Footwear Impact Research
Visualizing footwear's impact on movement.
A 2019 research prototype exploring how different footwear changes gait patterns and how low-cost wearable IMUs could capture and visualize those changes without relying on expensive lab equipment.
9
Healthy participants in evaluation
3
Test conditions: barefoot, comfortable, uncomfortable
40ms
Bluetooth capture interval from shank IMUs
My Role
User Research, Research Analysis, Problem Definition, Concept Development, Prototyping, and User Testing.
The Team
1 designer, 1 professor
Timeline
Jan 2019 — Feb 2019
Focus
Accessible gait analysis through low-cost wearables, data capture, and visual interpretation.
Context
Project context: real-world impact and India's BHA sizing system.
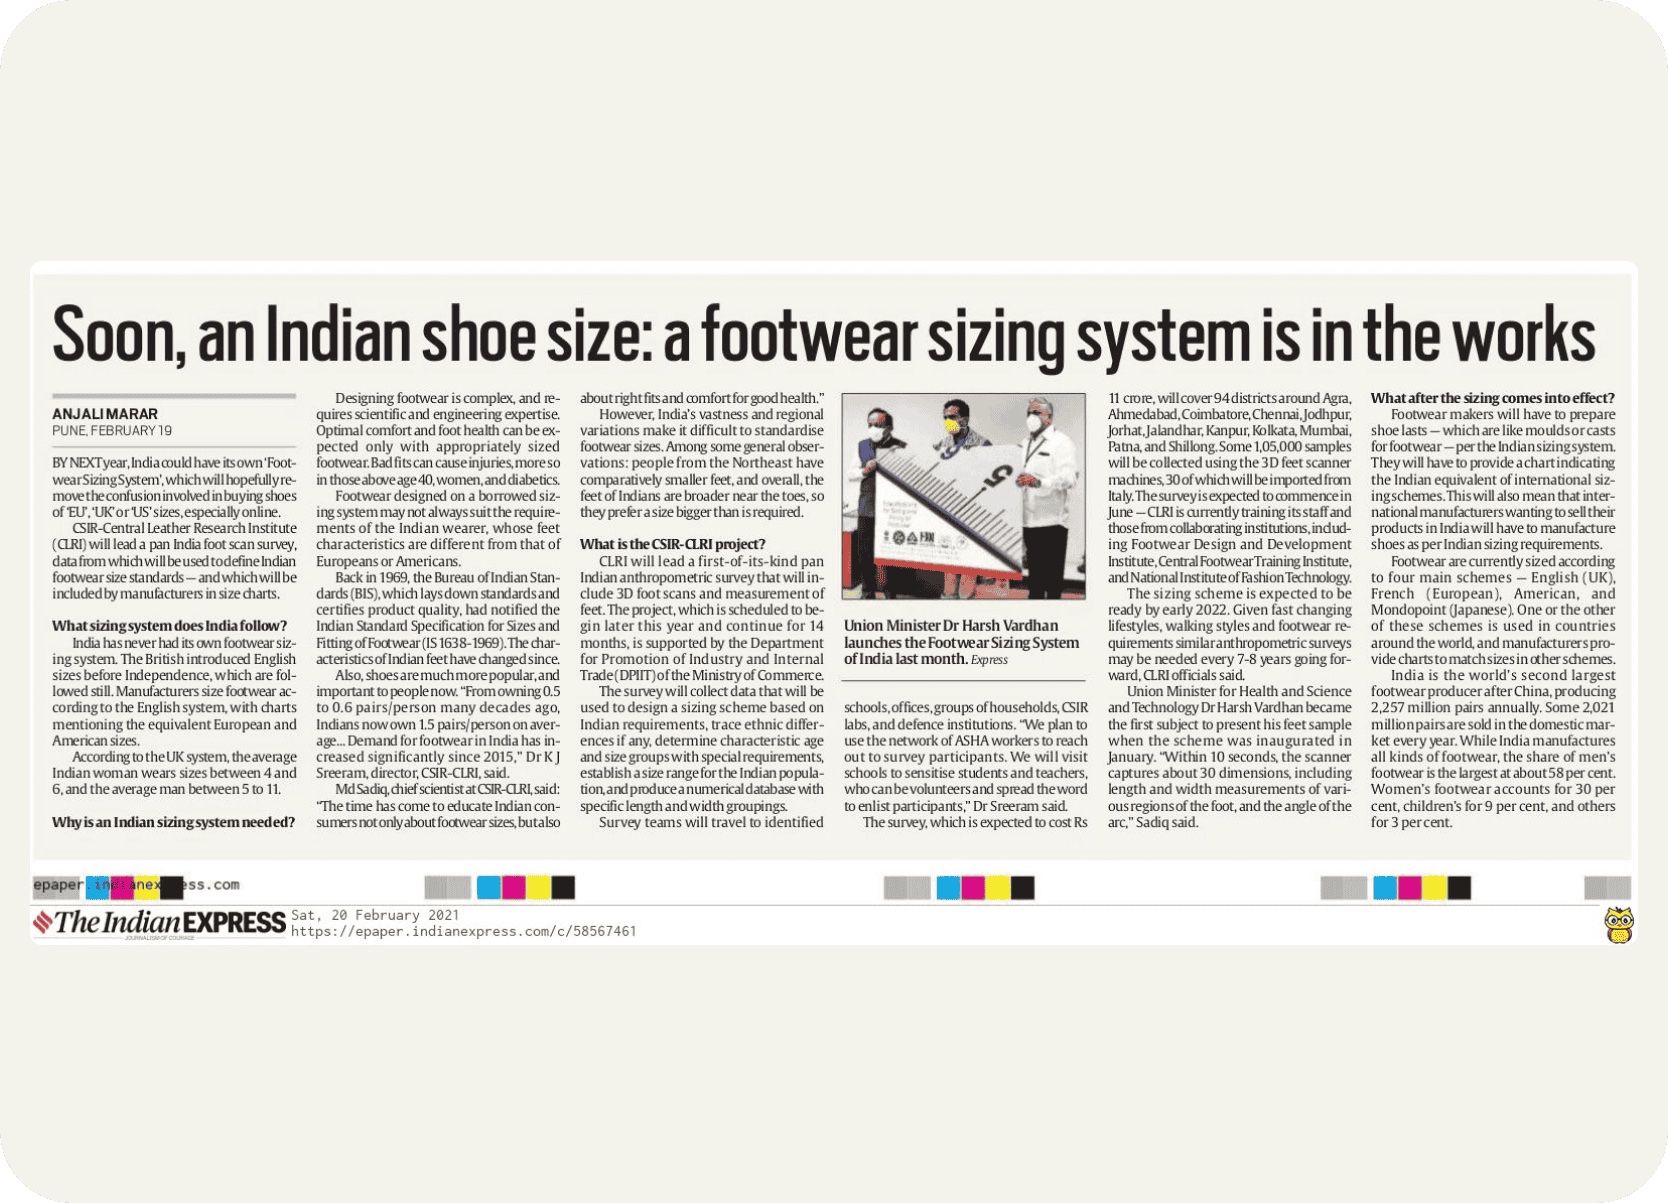
The original research was conducted in early 2019, but the problem remained relevant years later as India’s BHA footwear sizing system drew national attention to how poorly matched imported sizing standards can affect comfort and movement.
Conducted in early 2019, this research explored how different footwear affects individual walking gait patterns, with the goal of visualizing these changes using accessible technology. The study underscored the importance of proper footwear fit for comfort, injury prevention, and maintaining a natural gait.
In 2024, the BHA (Bharat) footwear sizing system gained national attention in India, addressing the problem that standard European (EU) and UK sizing systems often fail to accommodate the average Indian foot. That development validates the original research premise: improper fit from ill-suited sizing significantly contributes to gait alterations and discomfort.
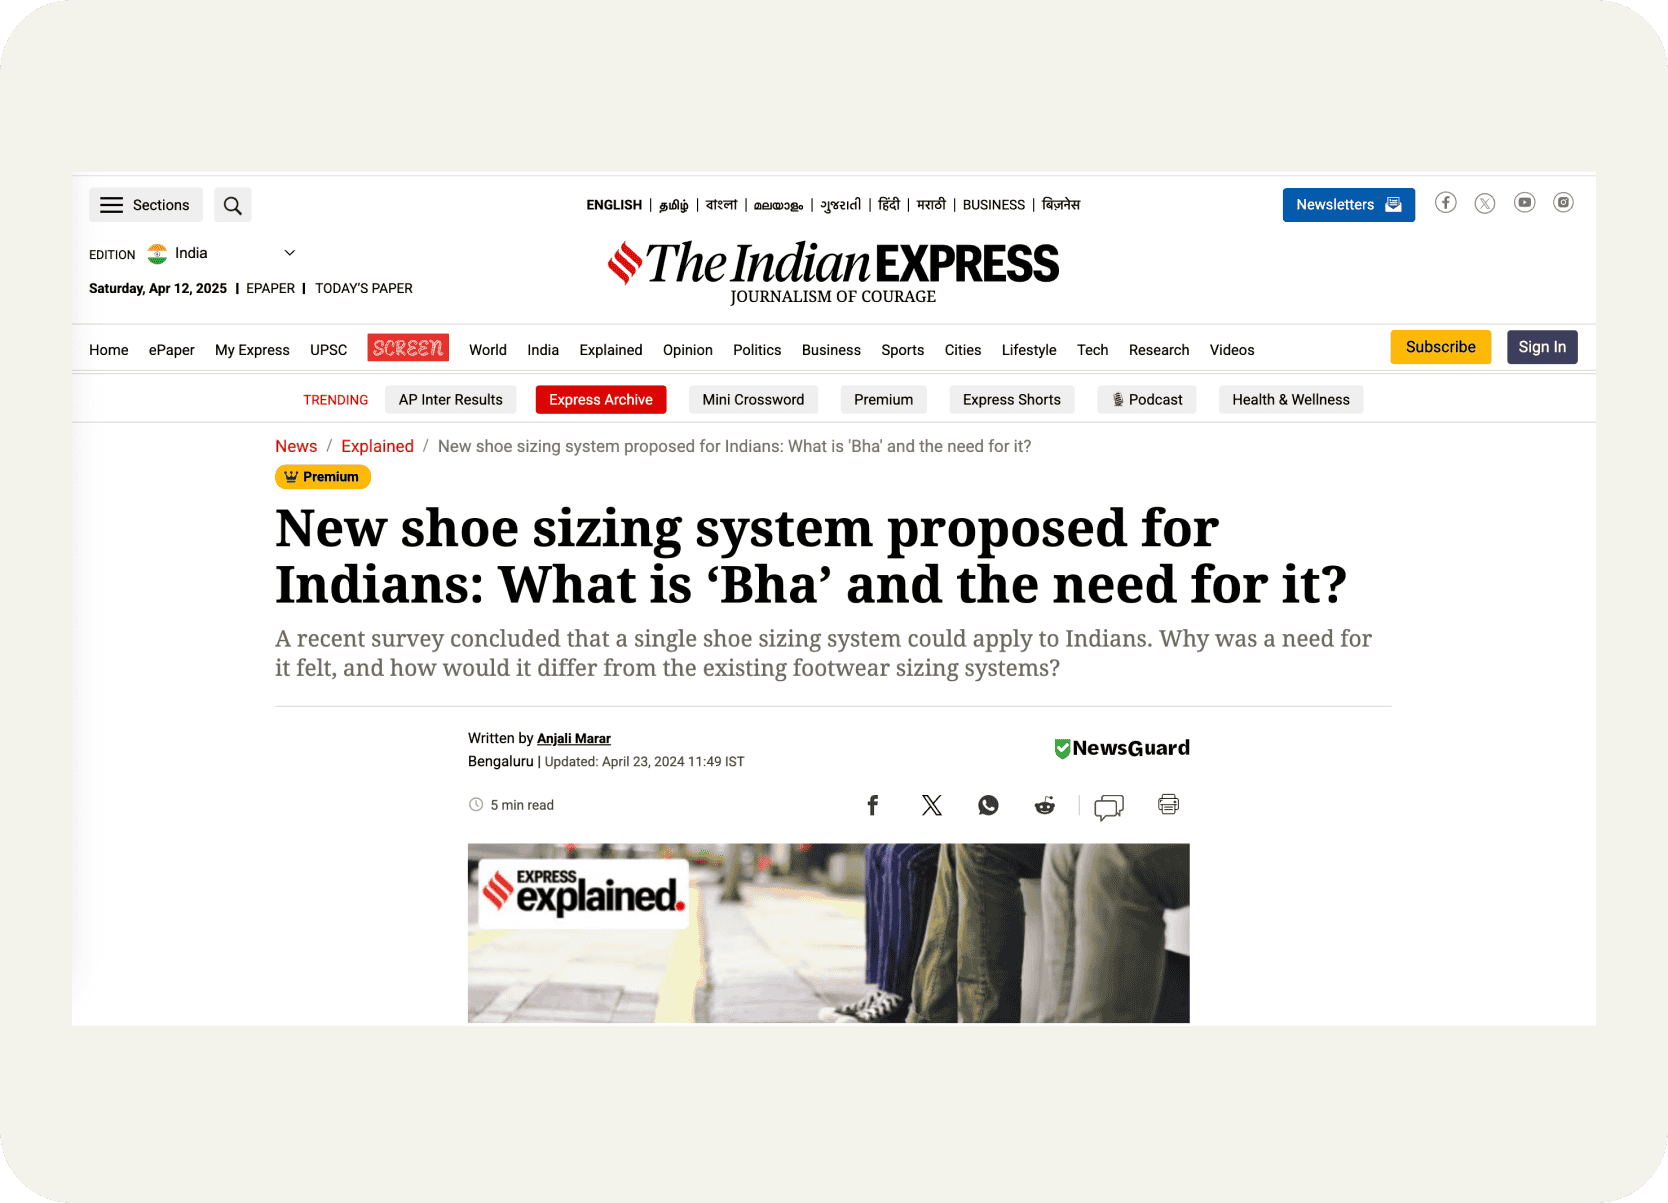

Visualizing these impacts is crucial for understanding why a dedicated Indian sizing standard matters for better foot health and comfort nationwide. The rest of this case study follows the original 2019 methodology and findings.
Problem
The problem: visualizing gait changes affordably.
Research already documented the negative effects of improper footwear on gait mechanics, but actually showing those changes to an individual usually required expensive laboratory setups.
While the impacts of improper footwear, including reduced support or restrictive form factors like high heels, are documented in research, easily visualizing these gait changes for individual users remains difficult.
Traditional gait analysis relies on expensive laboratory systems such as motion-capture cameras and force plates. That limits accessibility for everyday users, clinicians, coaches, and even footwear designers. The opportunity was a low-cost, portable way to capture gait data and present it visually so users could understand how different shoes affected their own movement patterns.
Methodology
Methodology: prototyping a low-cost IMU system.
The prototype combined inexpensive hardware, Bluetooth data capture, and visualization in Tableau to compare barefoot gait with comfortable and uncomfortable footwear conditions.
1. Hardware
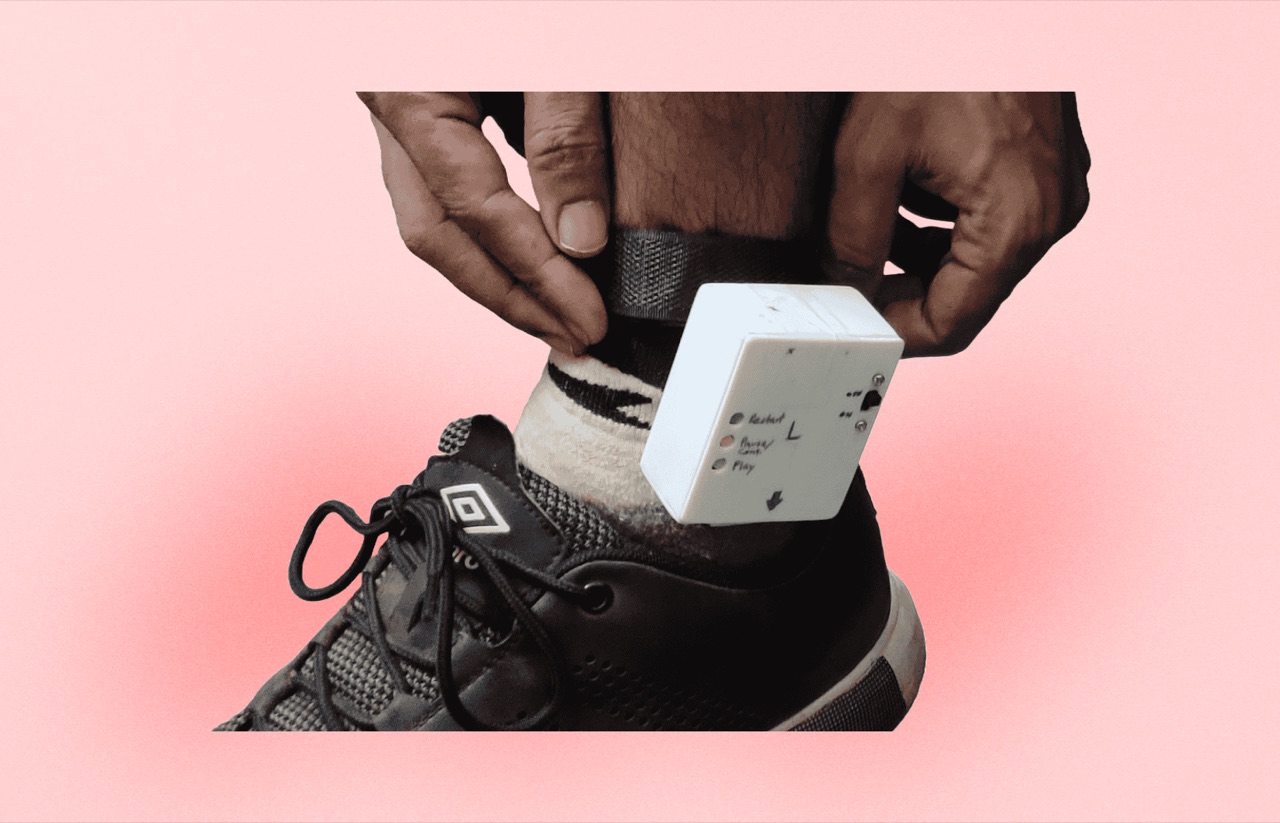
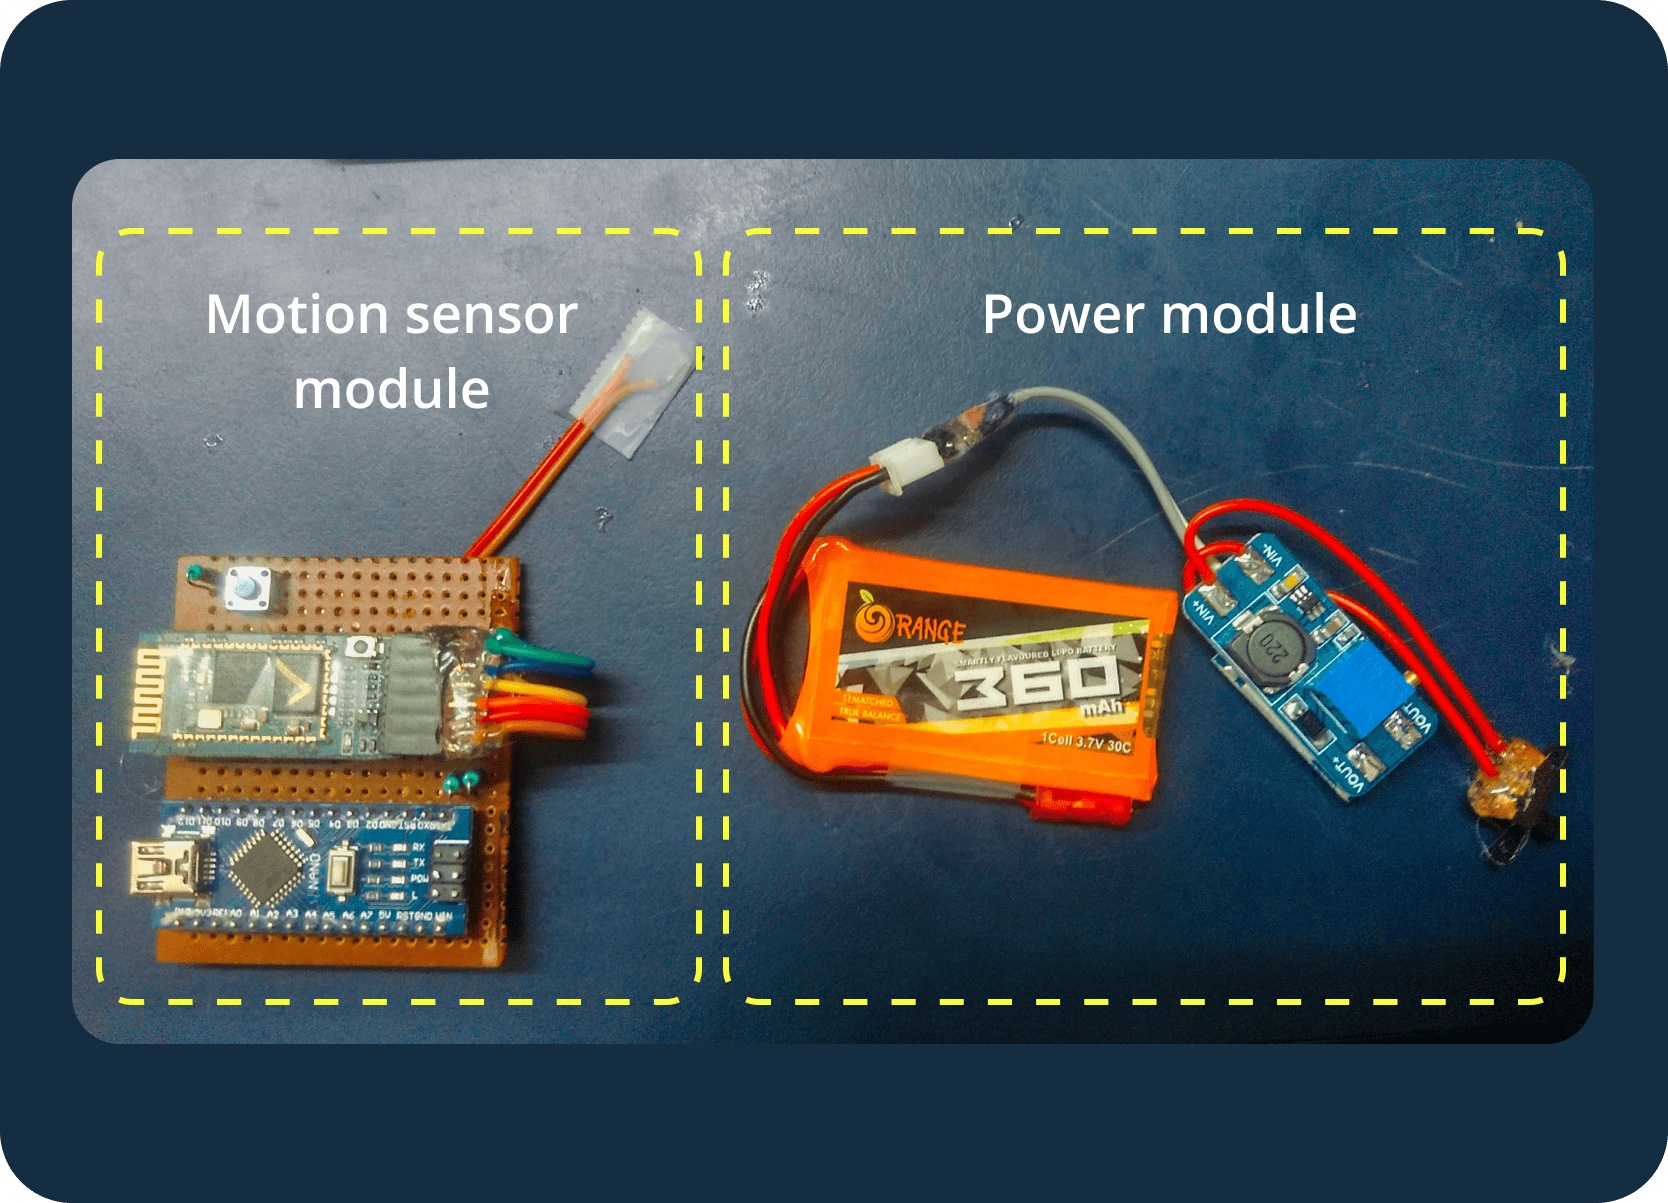
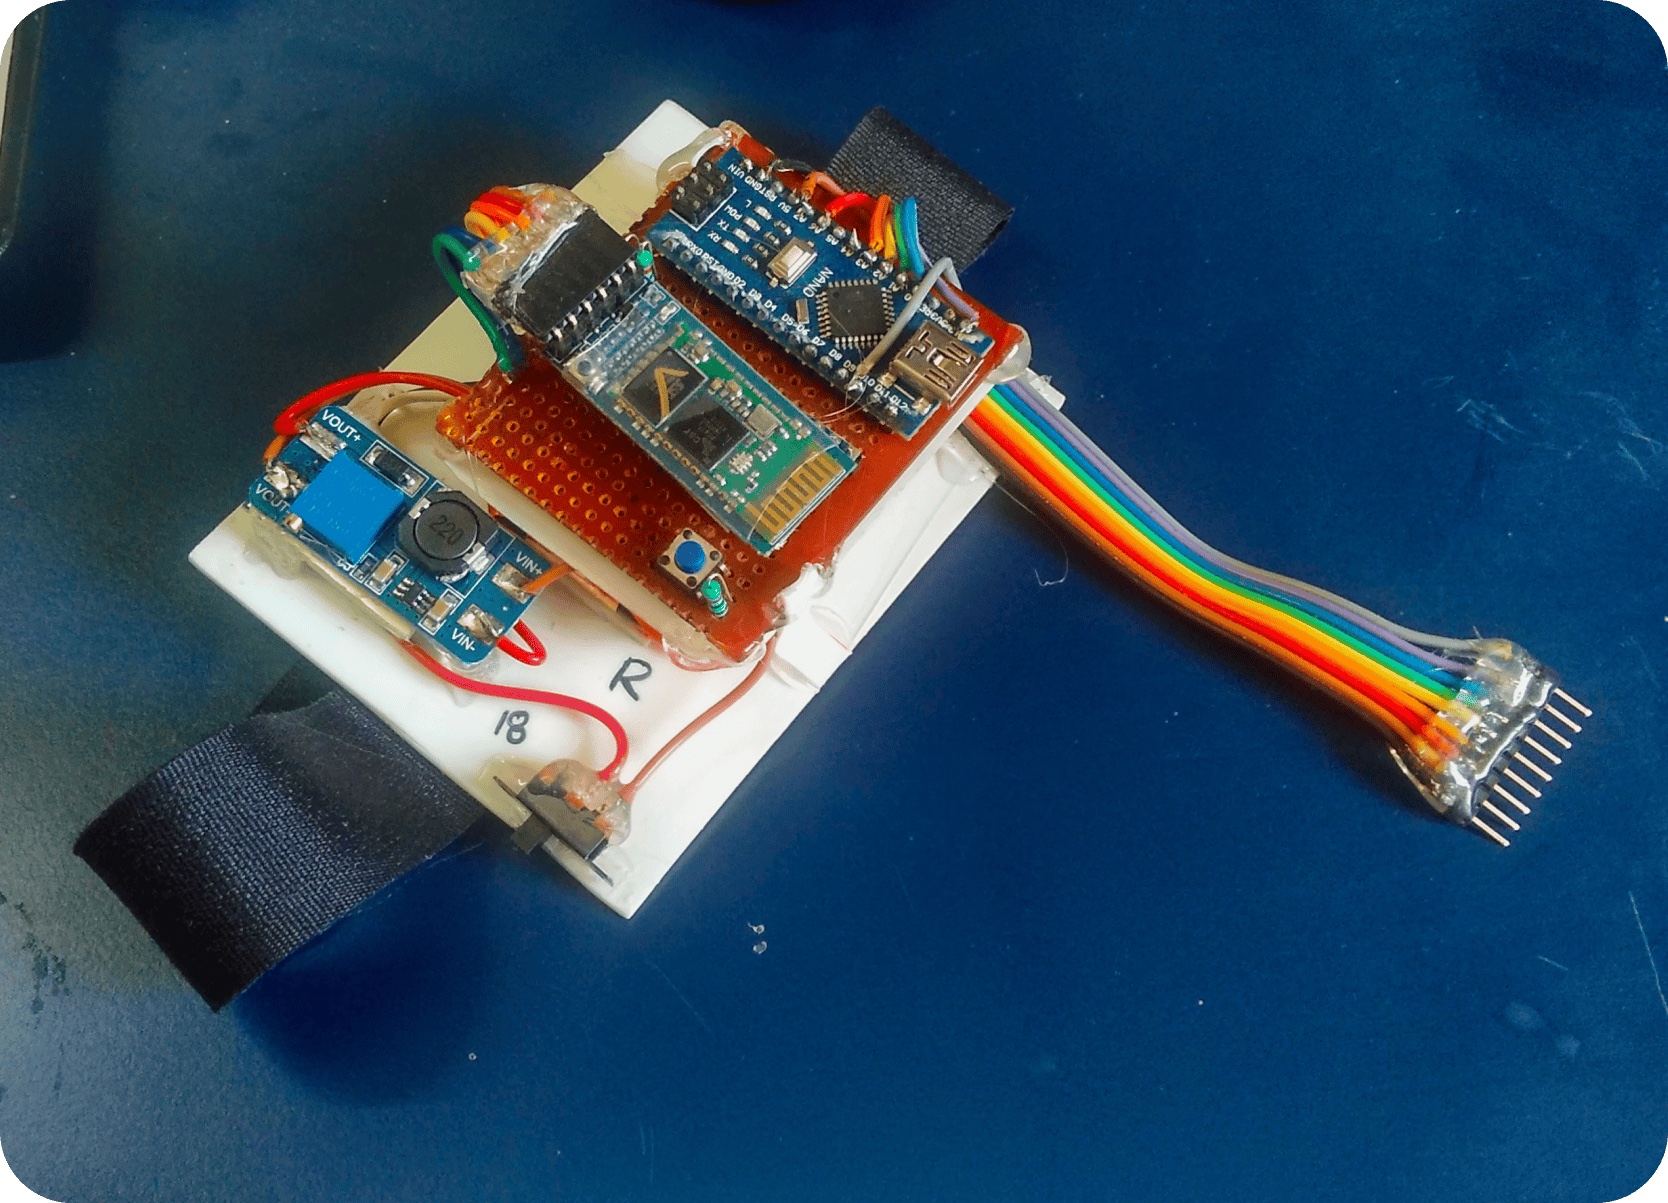
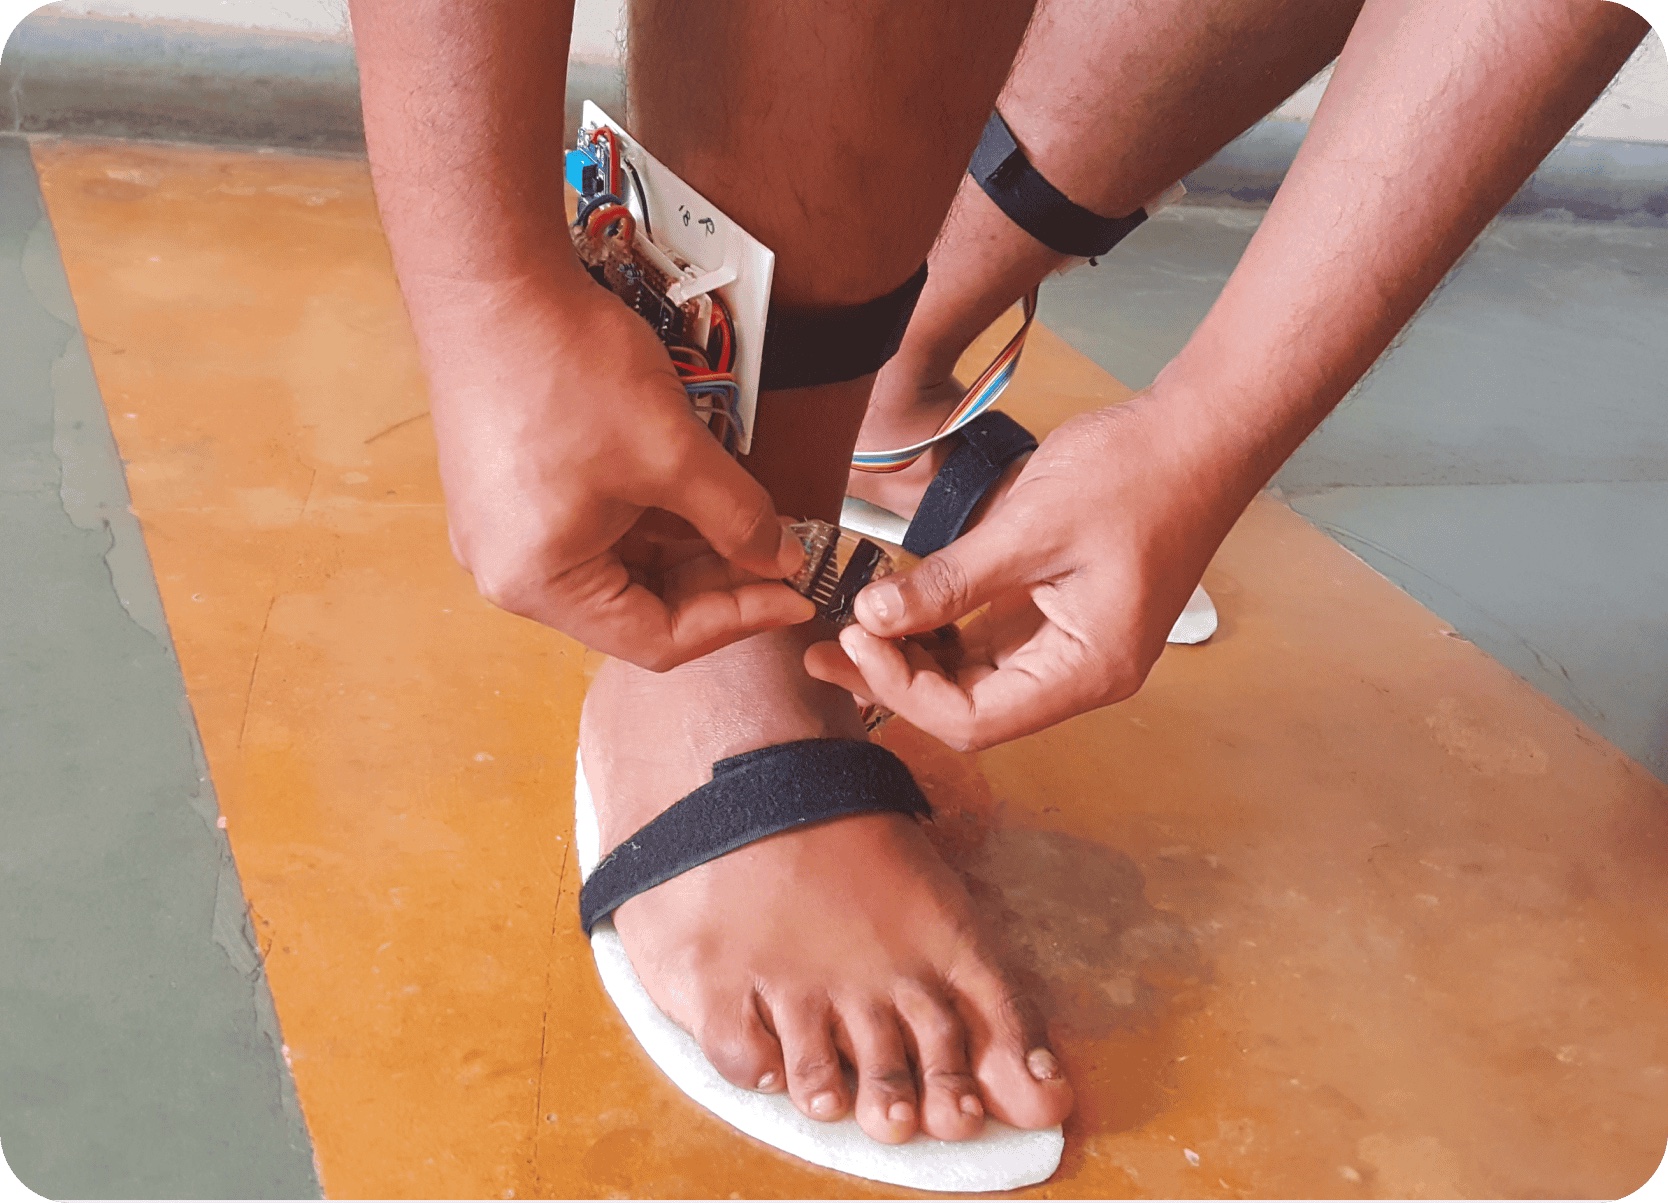
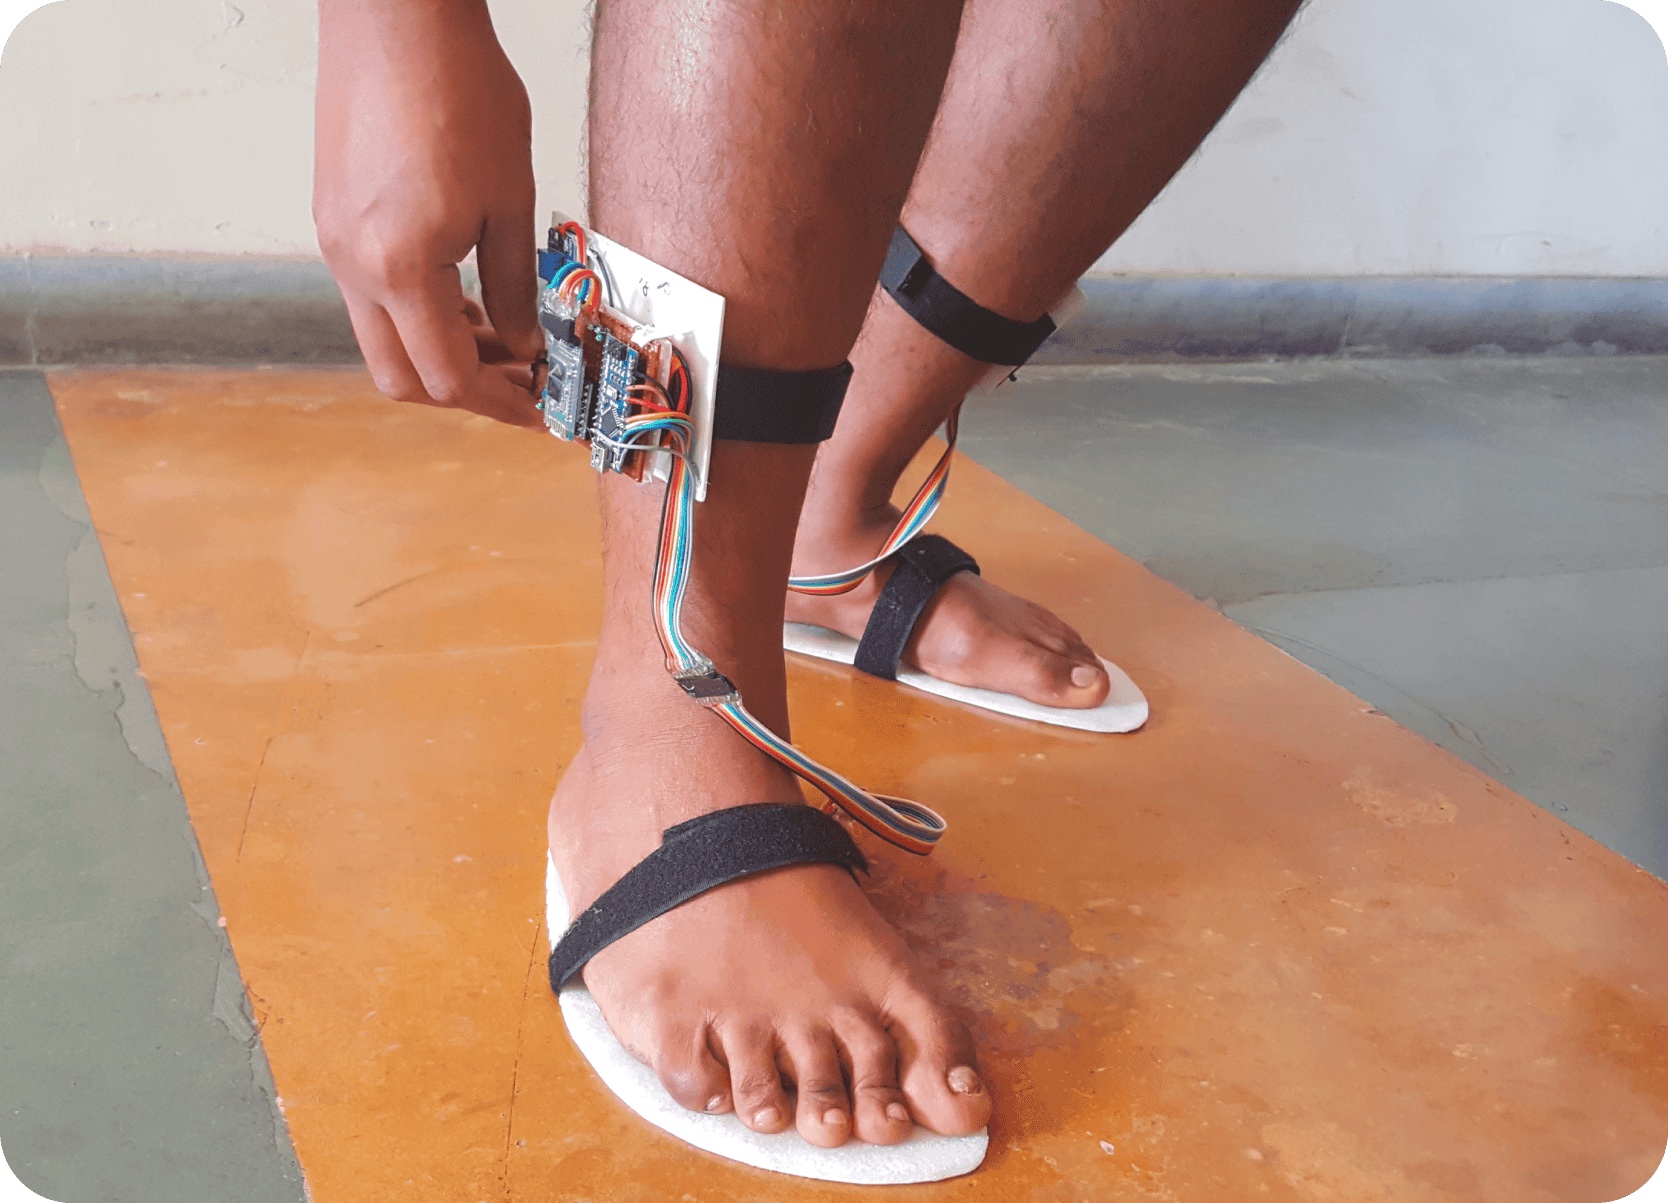
Shank Sensor Modules (x2): Each module, worn on the outer side of the lower leg (shank), contained an MPU6050 IMU (accelerometer + gyroscope), an Arduino Nano microcontroller, an HC05 Bluetooth module for wireless communication, and a 360mAh LiPo battery power system.
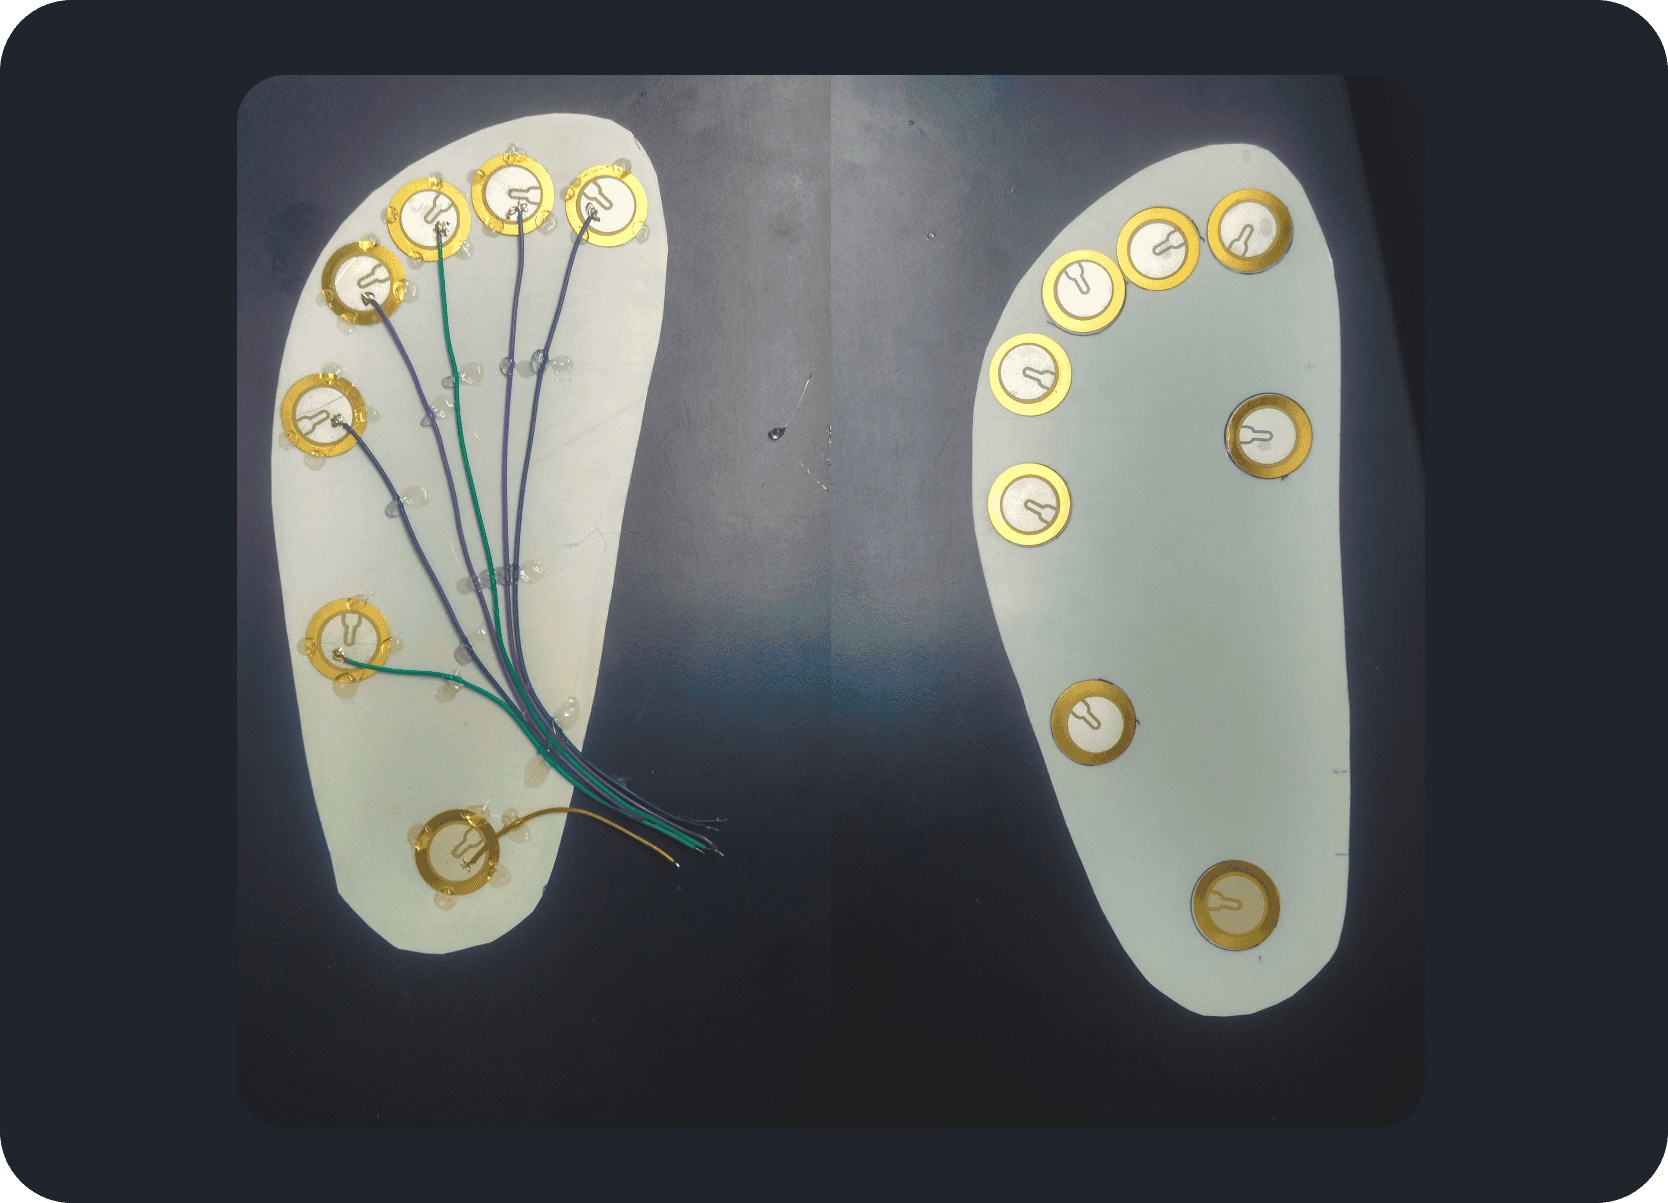
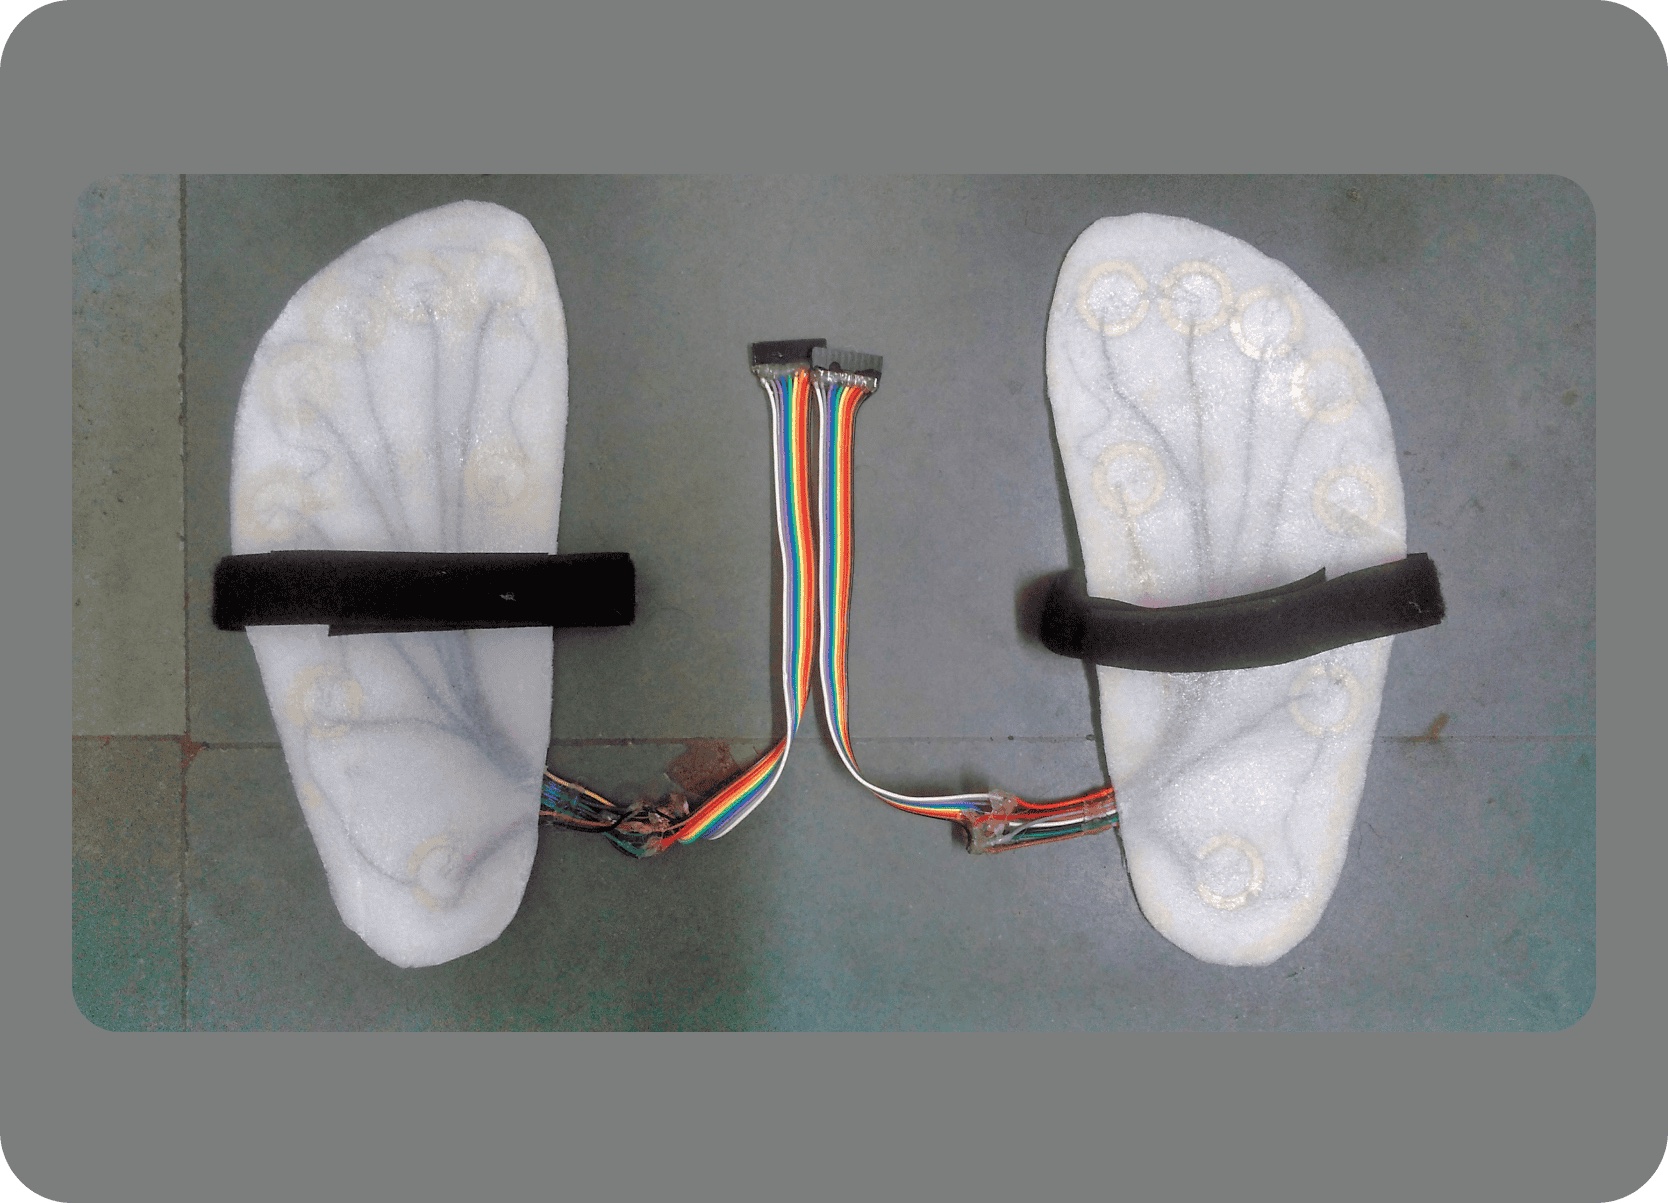
Foot Sensor Modules (x2 - initial concept, not used in final user testing): Initially designed with piezoelectric sensors under a foam layer to detect heel-strike and toe-off events, but excluded from user testing due to universality limitations, rigidity, and the risk of interfering with natural gait.
2. Software
A Python script captured timestamps, 3-axis acceleration, and 3-axis angular position from both shank IMUs via Bluetooth every 40ms.
The captured data was saved into a CSV file for later analysis.
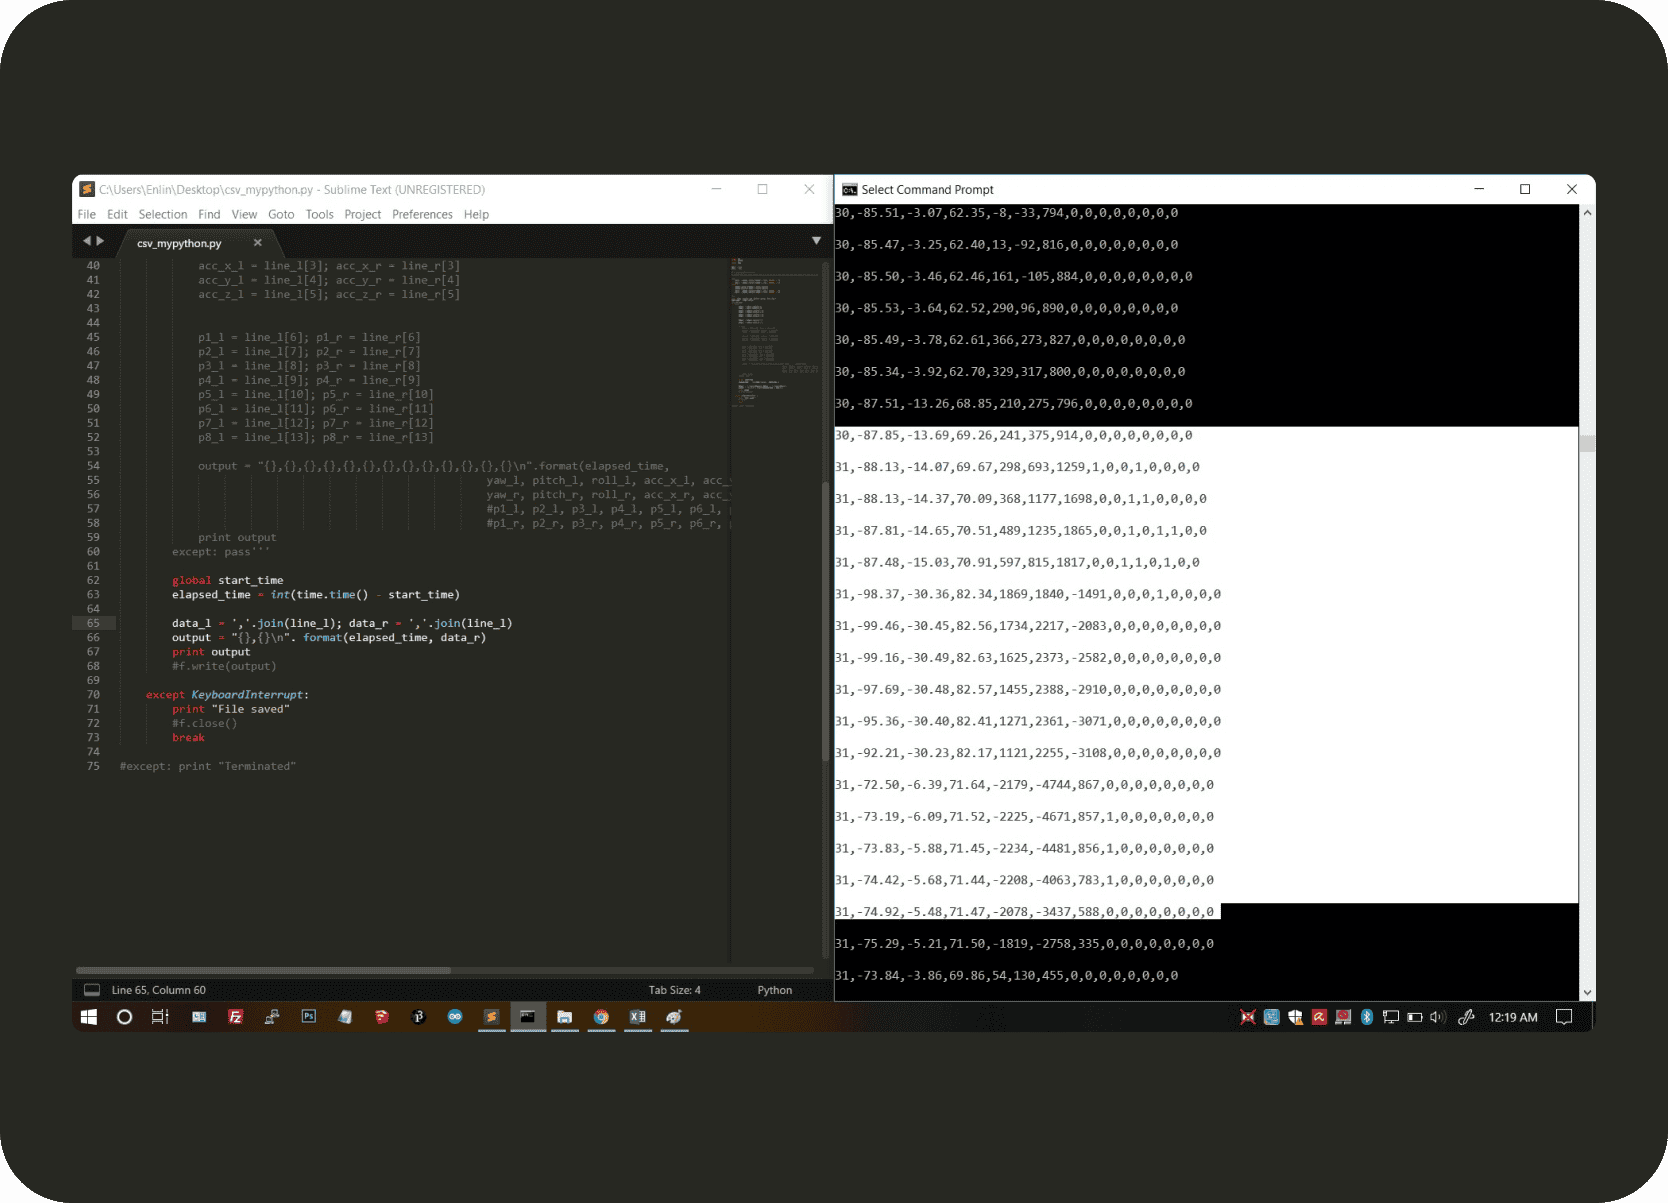
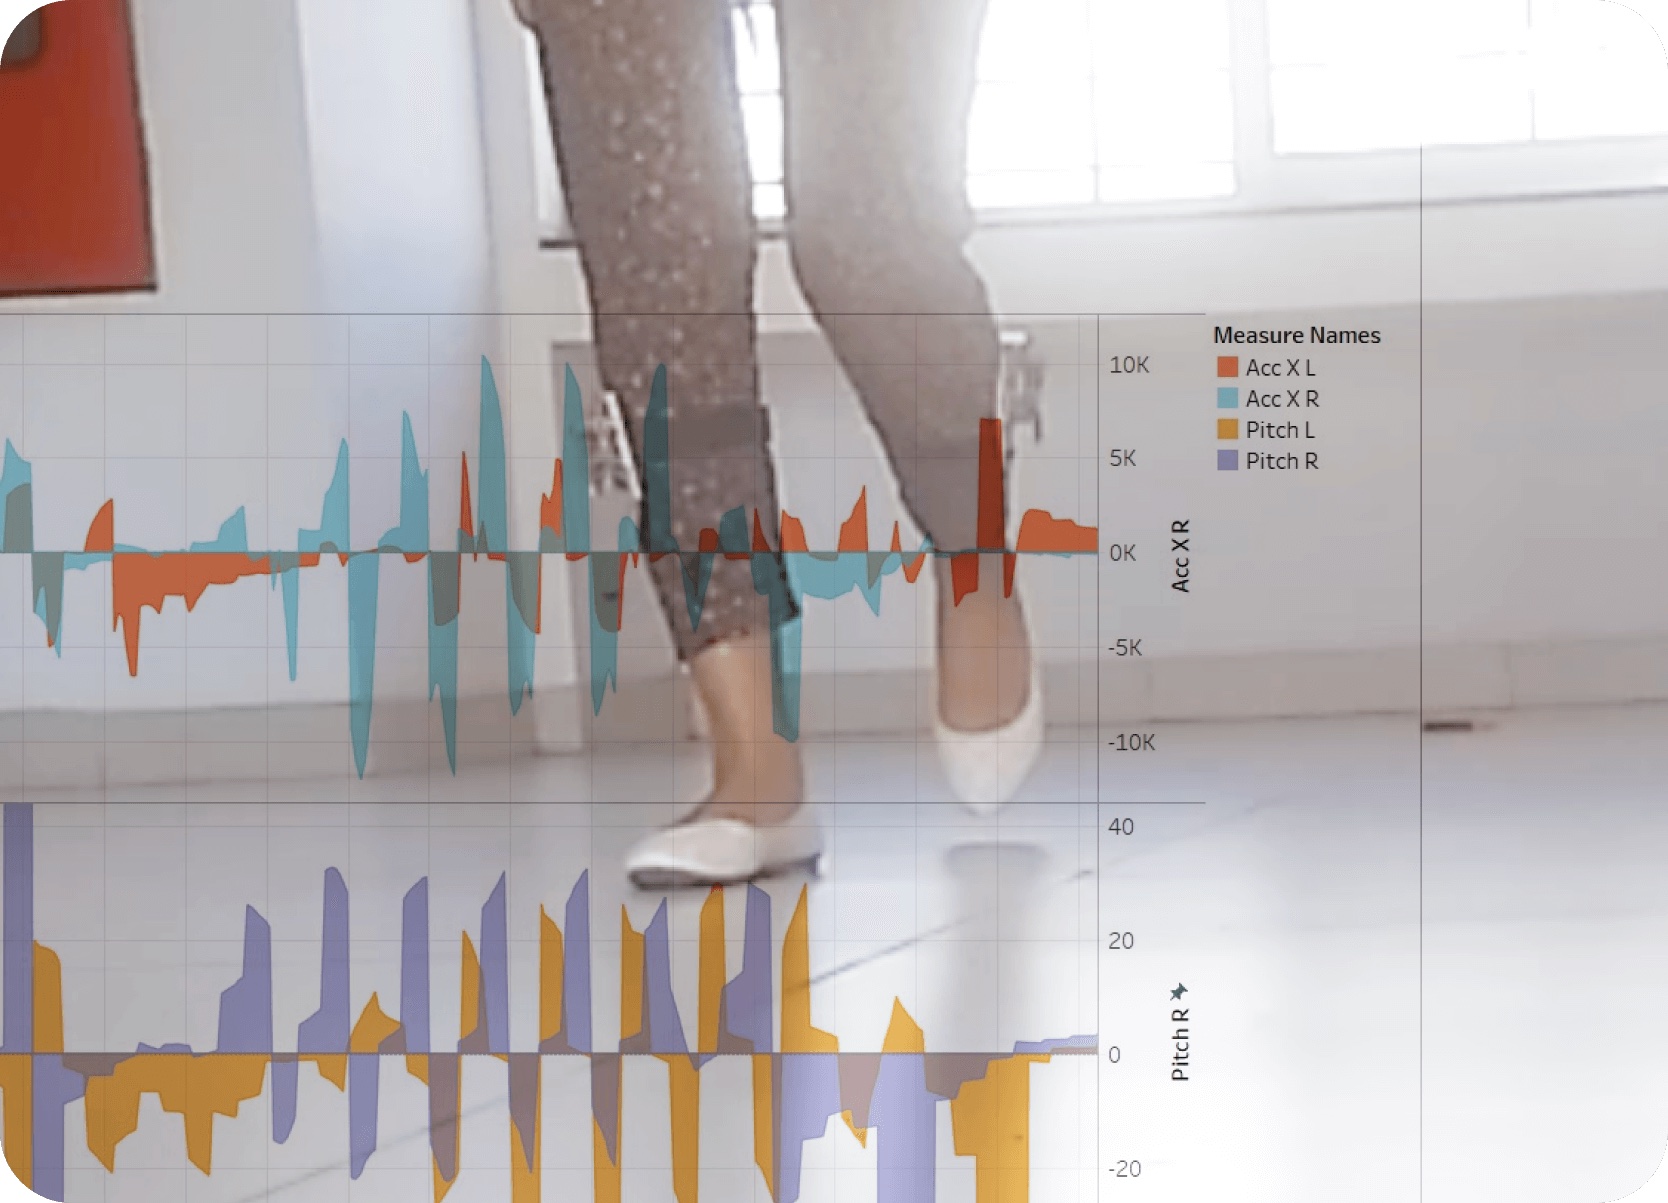
Tableau was used to visualize the captured data, primarily plotting shank acceleration and angular position (pitch axis) over time for both legs on dual-axis area charts.
Setup
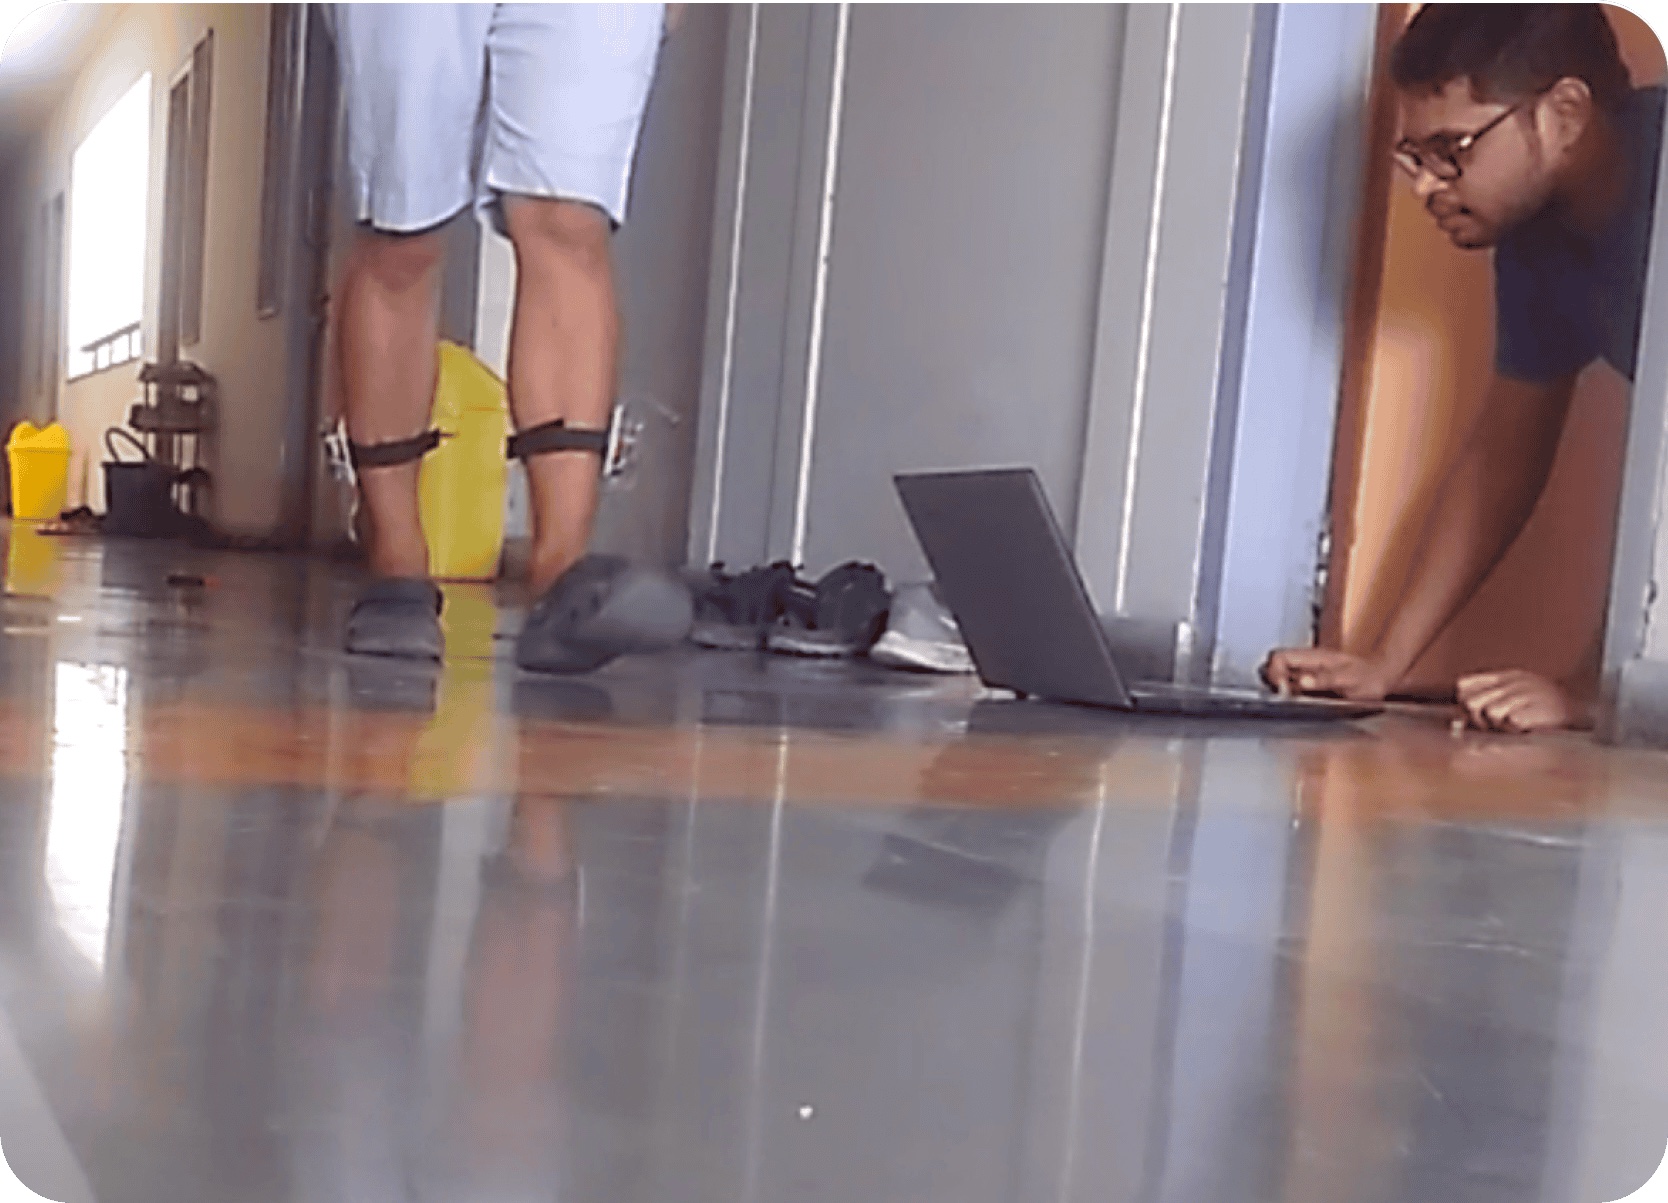
Sensors were attached to participants' shanks using Velcro straps and connected wirelessly to a laptop running the Python capture script during walking trials.
Visualization
Gait data visualization approach.
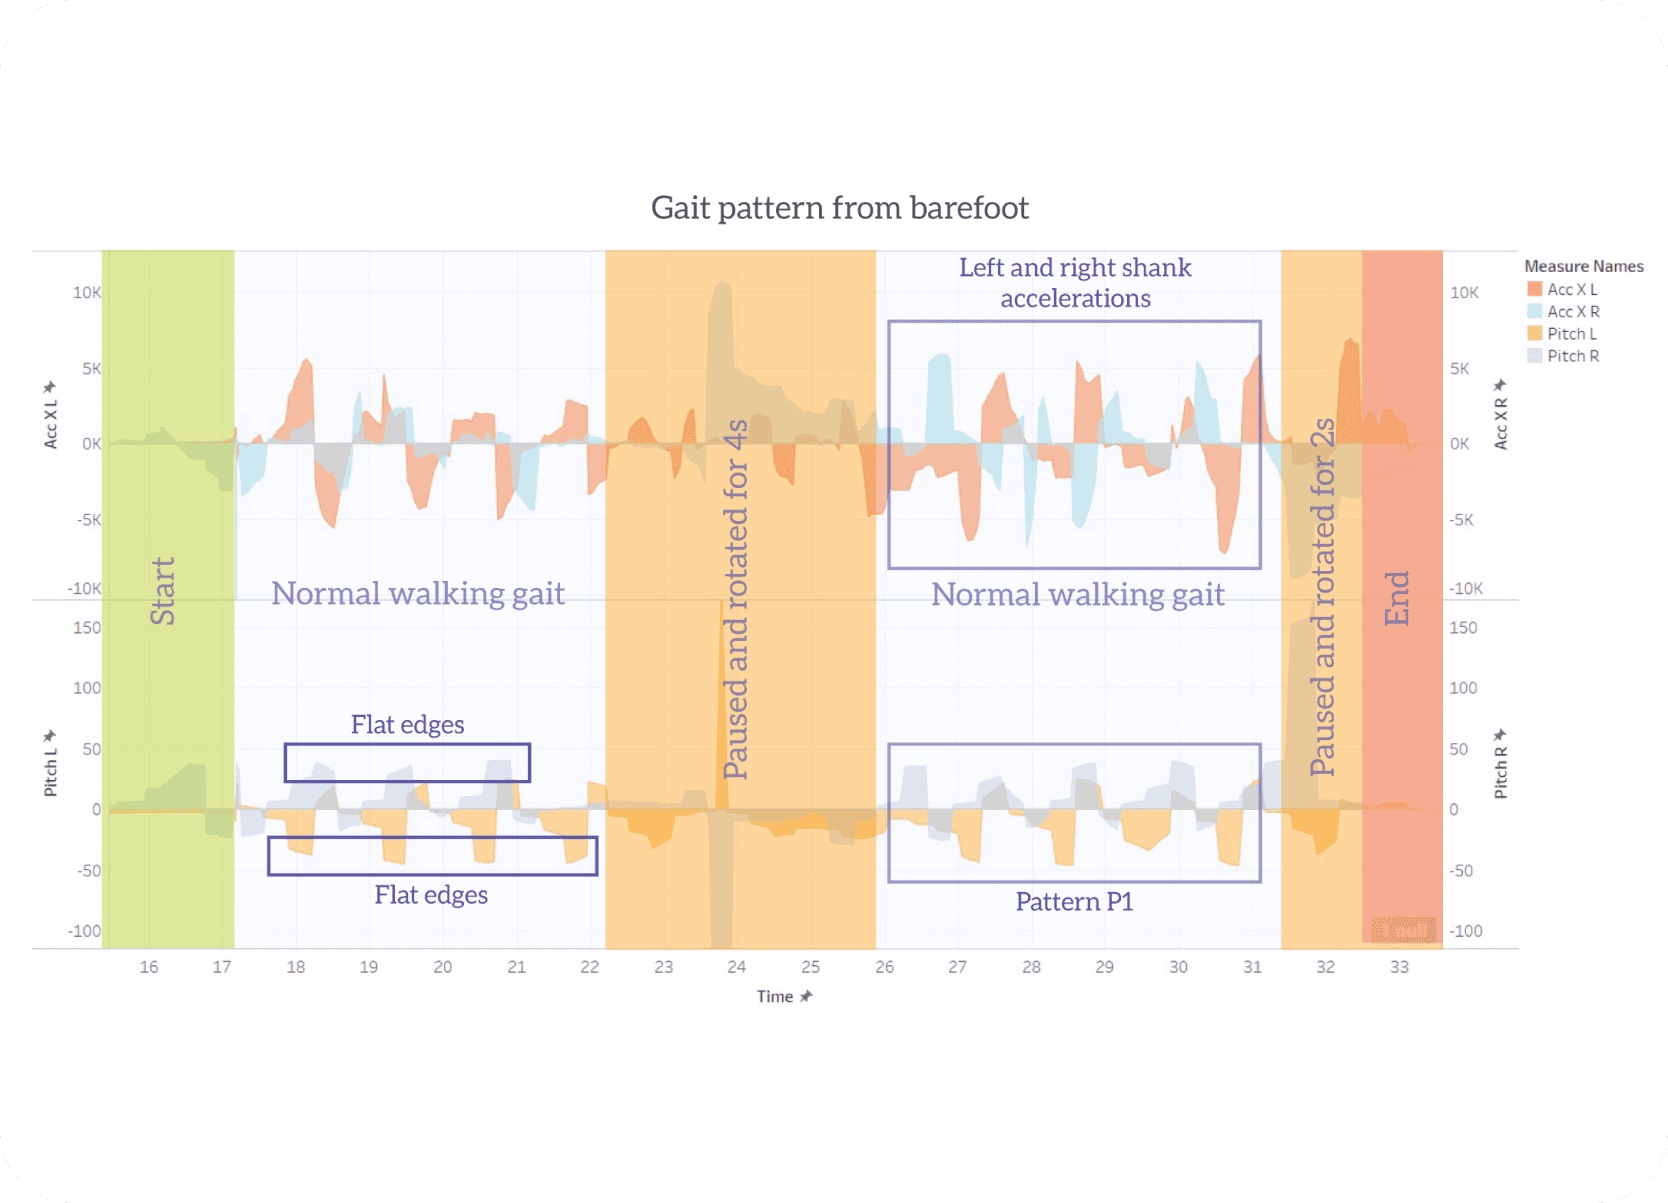
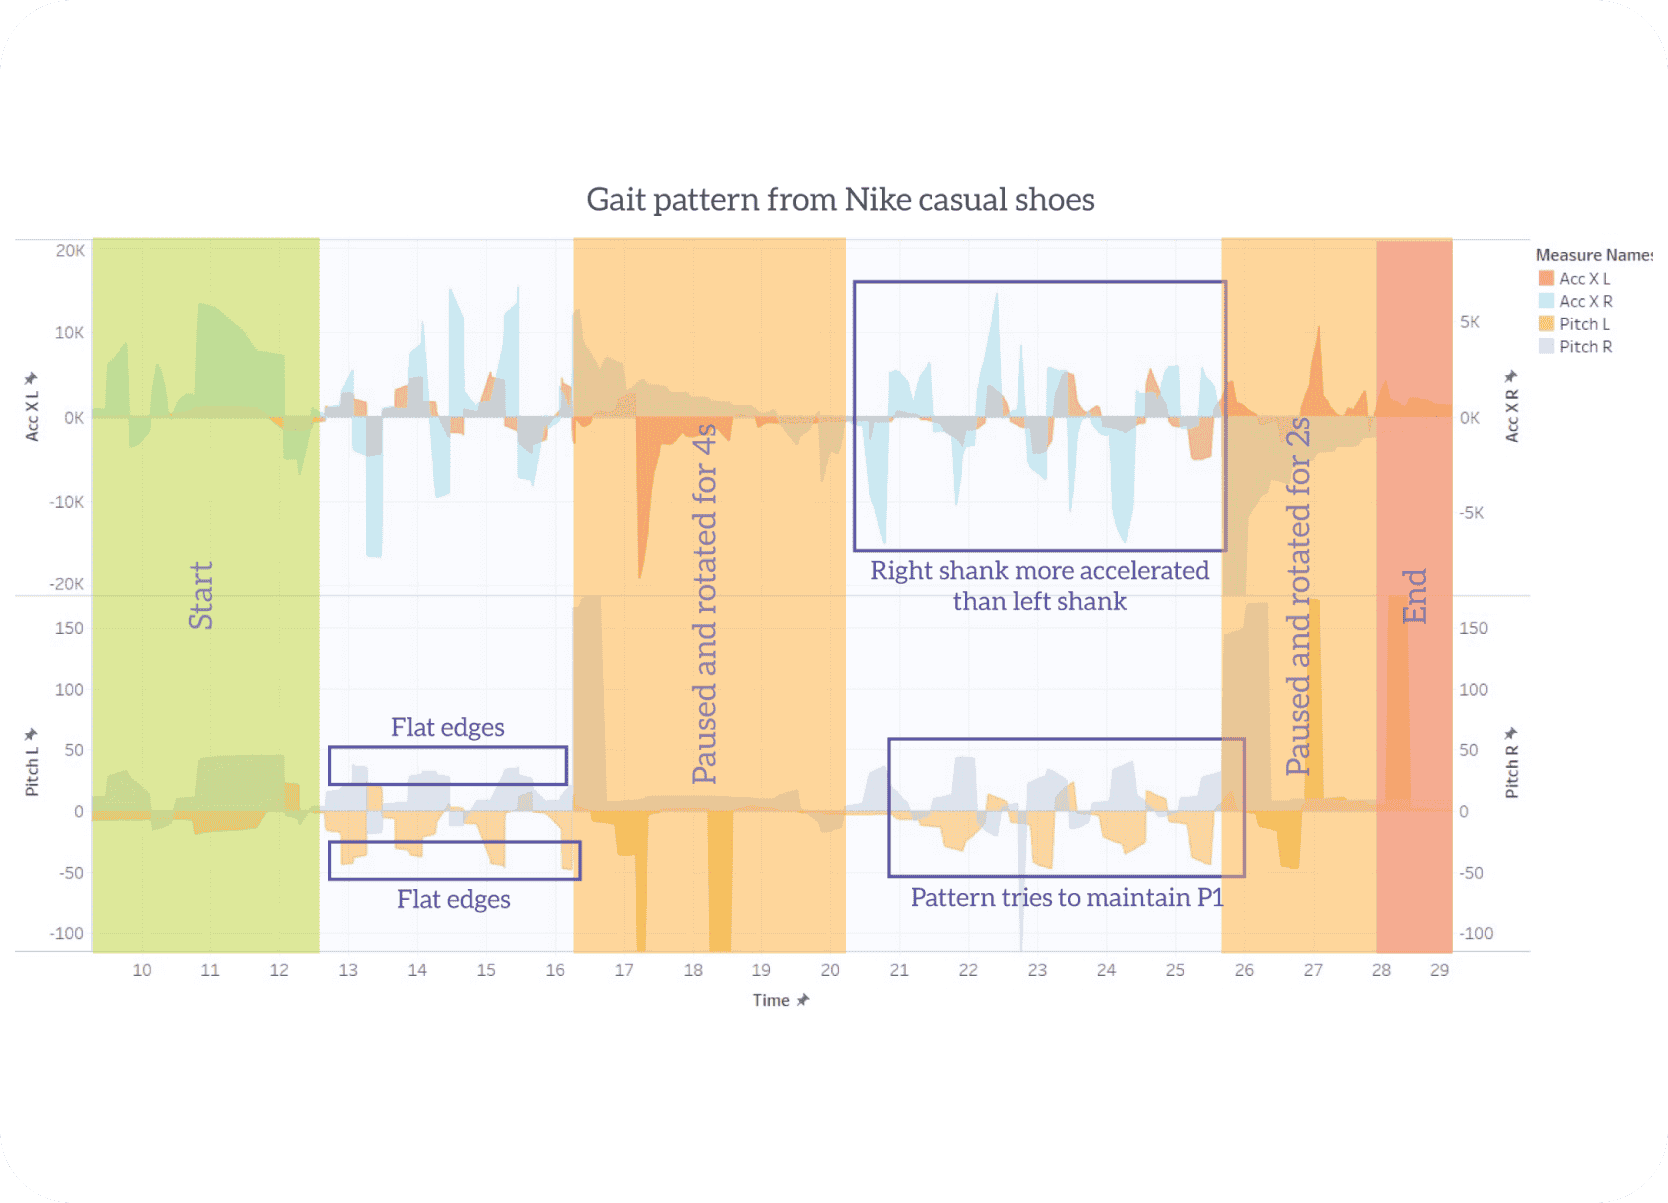
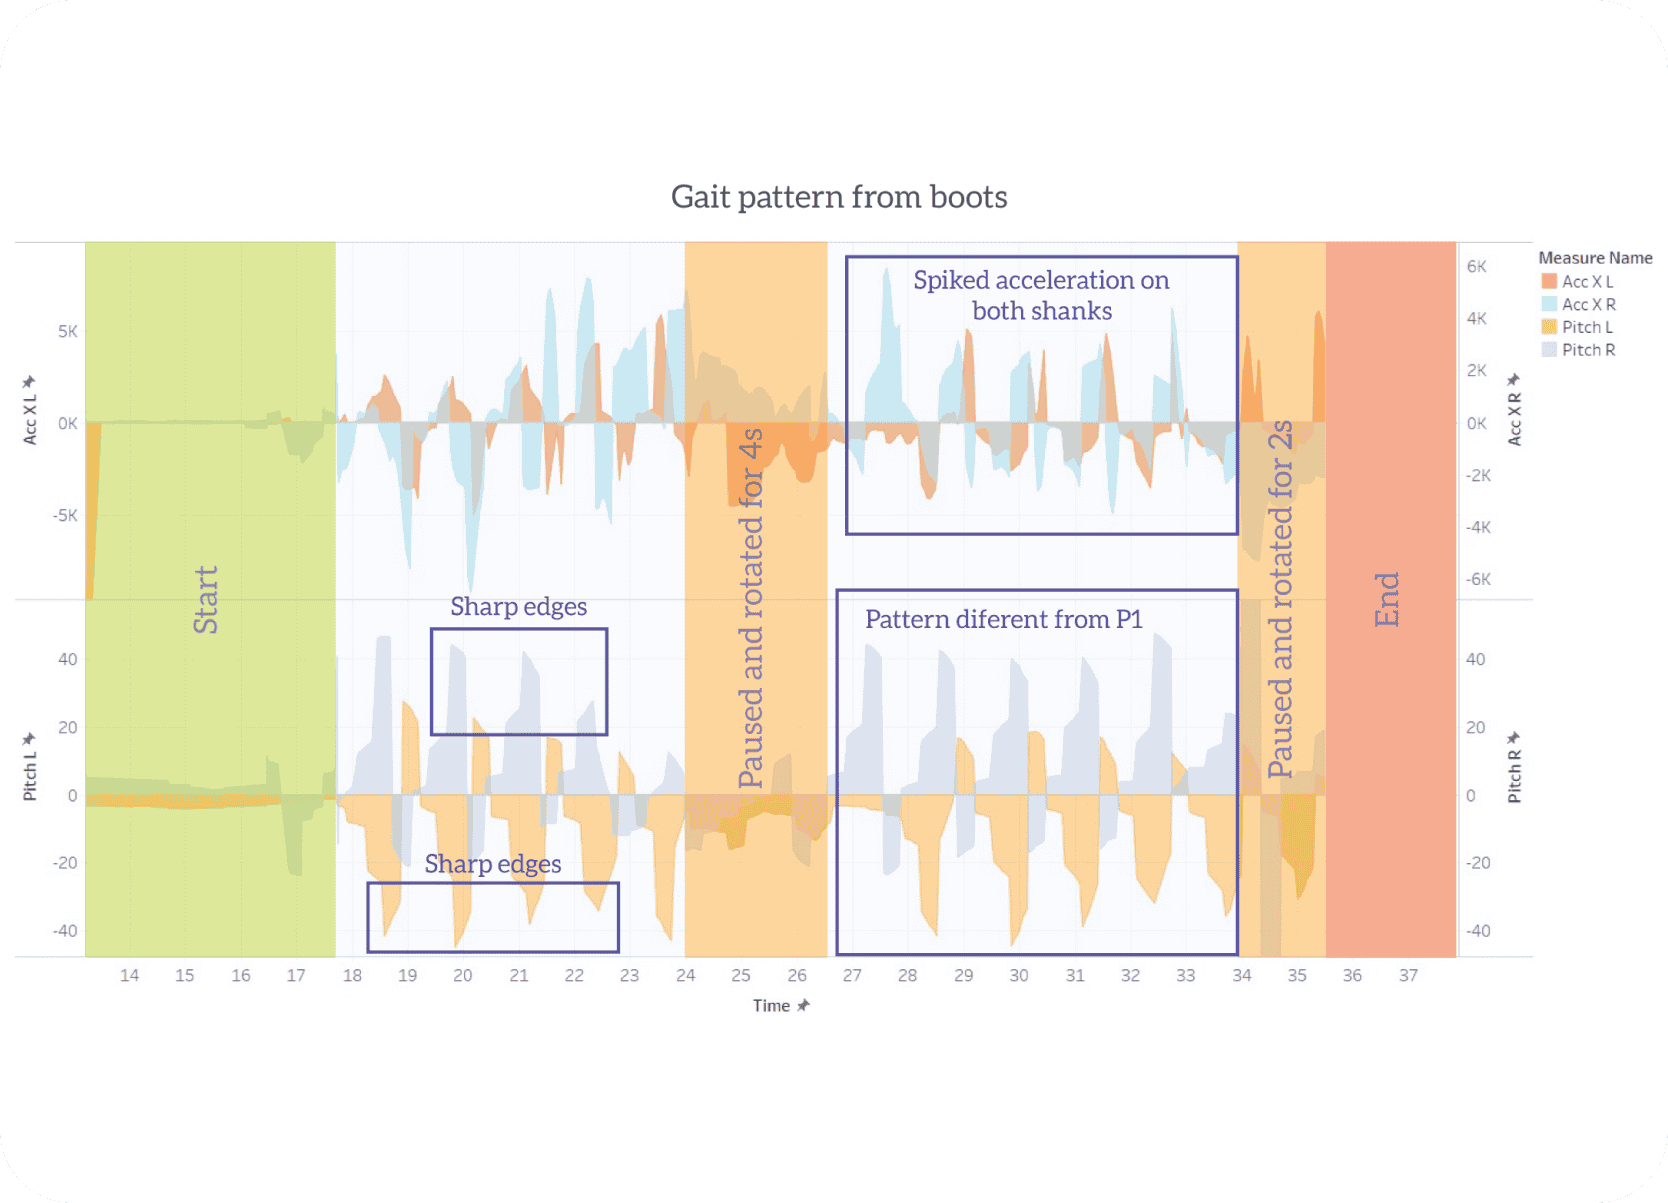
The core output was a set of visual comparisons between barefoot and different footwear conditions, designed to make gait events and left-right differences readable without specialist equipment.
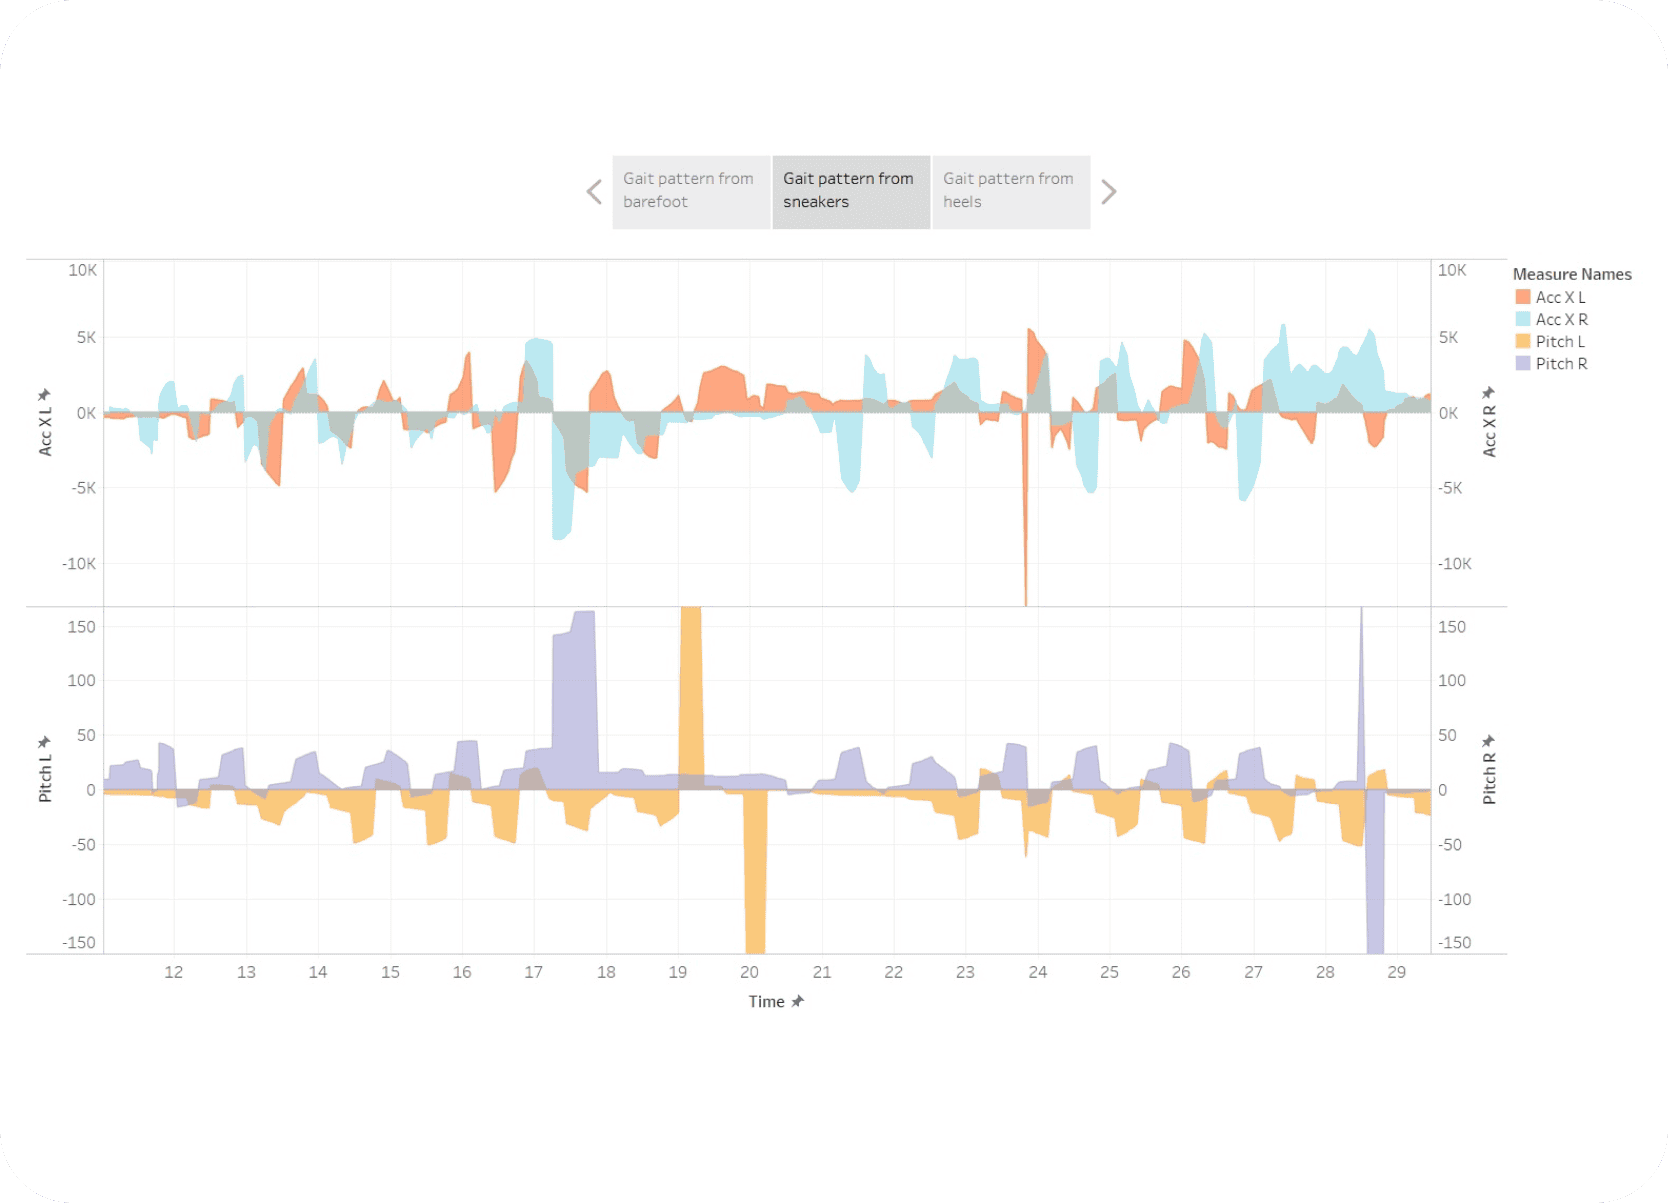
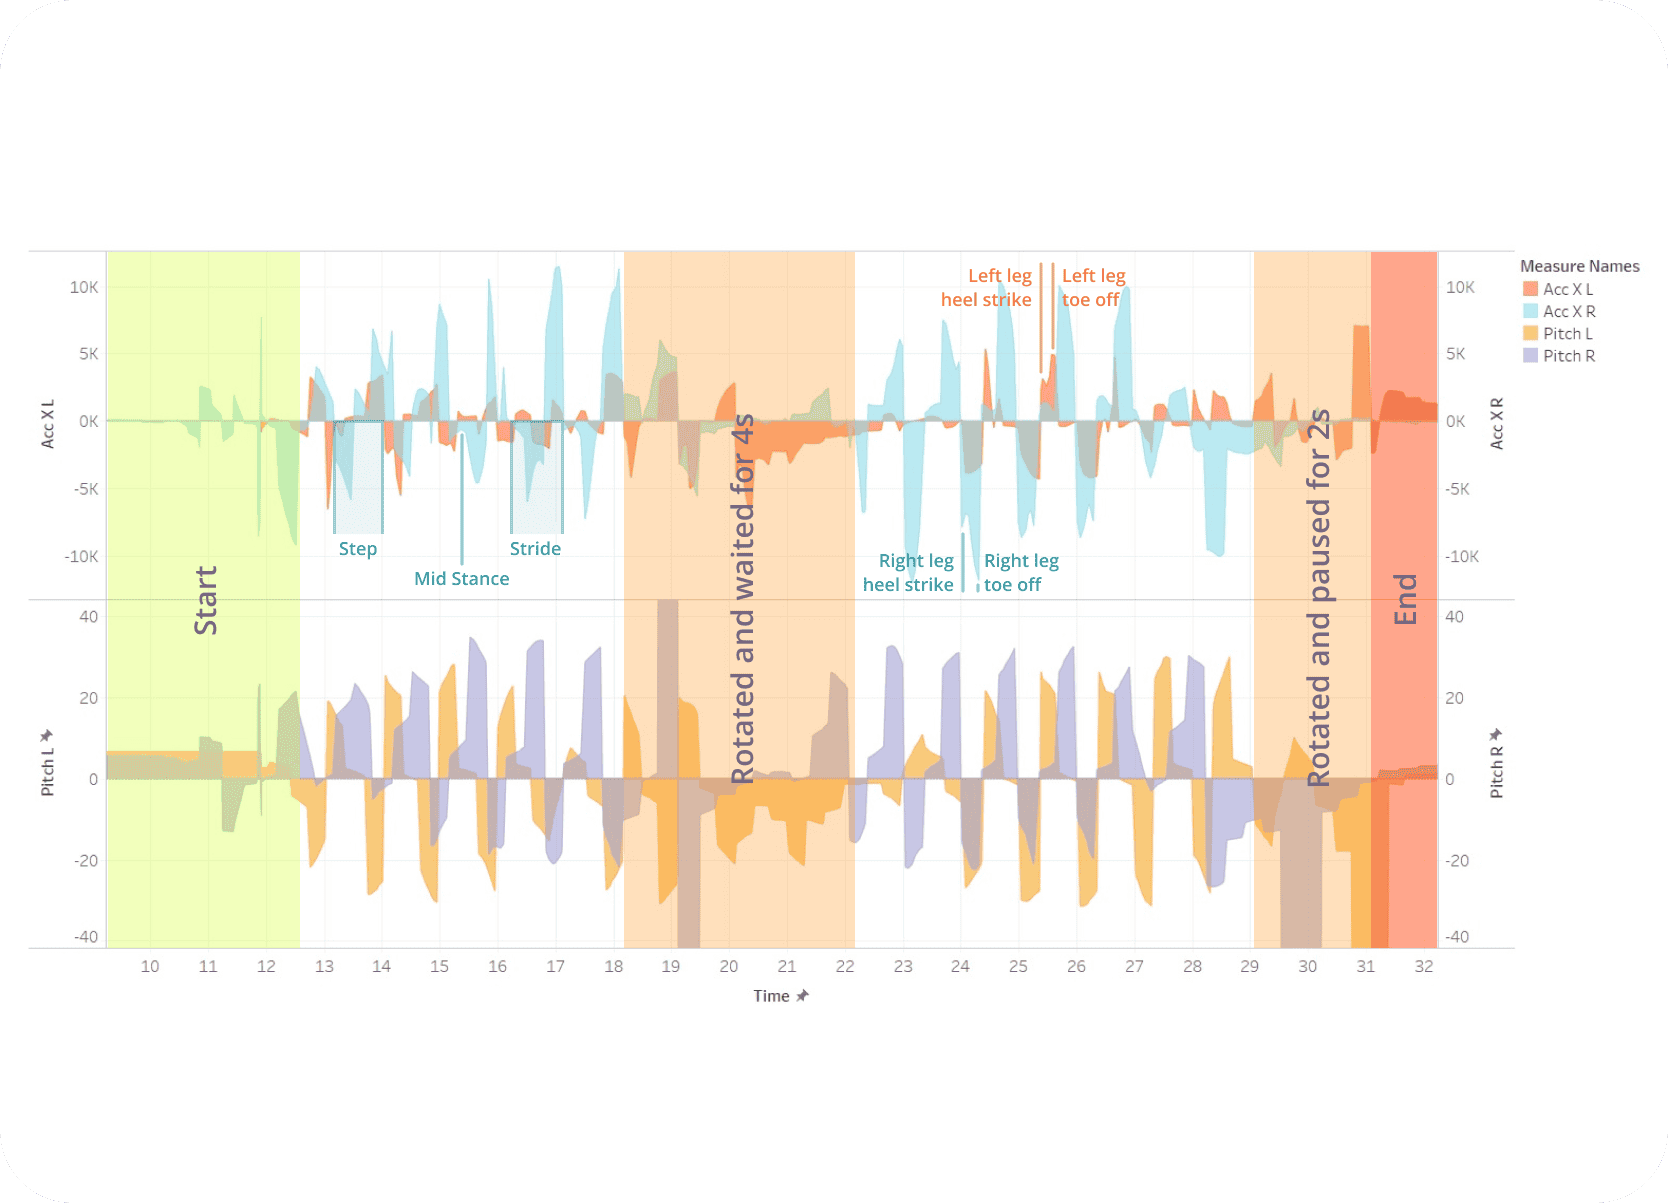
The main visualization used dual-axis area charts in Tableau, comparing shank acceleration and angular position with reference standards to identify gait events such as swing, toe-off, heel strike, mid-stance, stride, step, and idle phases. Area charts were chosen over line charts primarily for aesthetic clarity.
Top chart: Left vs. right shank acceleration (X-axis) over time.
Bottom chart: Left vs. right shank angular position (pitch) over time.
Warm colors represented the left leg and cool colors the right leg, inspired by navigation-light conventions for quick visual parsing.
This structure allowed simultaneous comparison of both legs' movements, with acceleration expected to show the clearest variation when footwear changed.
Evaluation
User evaluation and findings.
The prototype was evaluated with nine healthy participants who walked the same path across barefoot, comfortable-footwear, and uncomfortable-footwear conditions.
Procedure
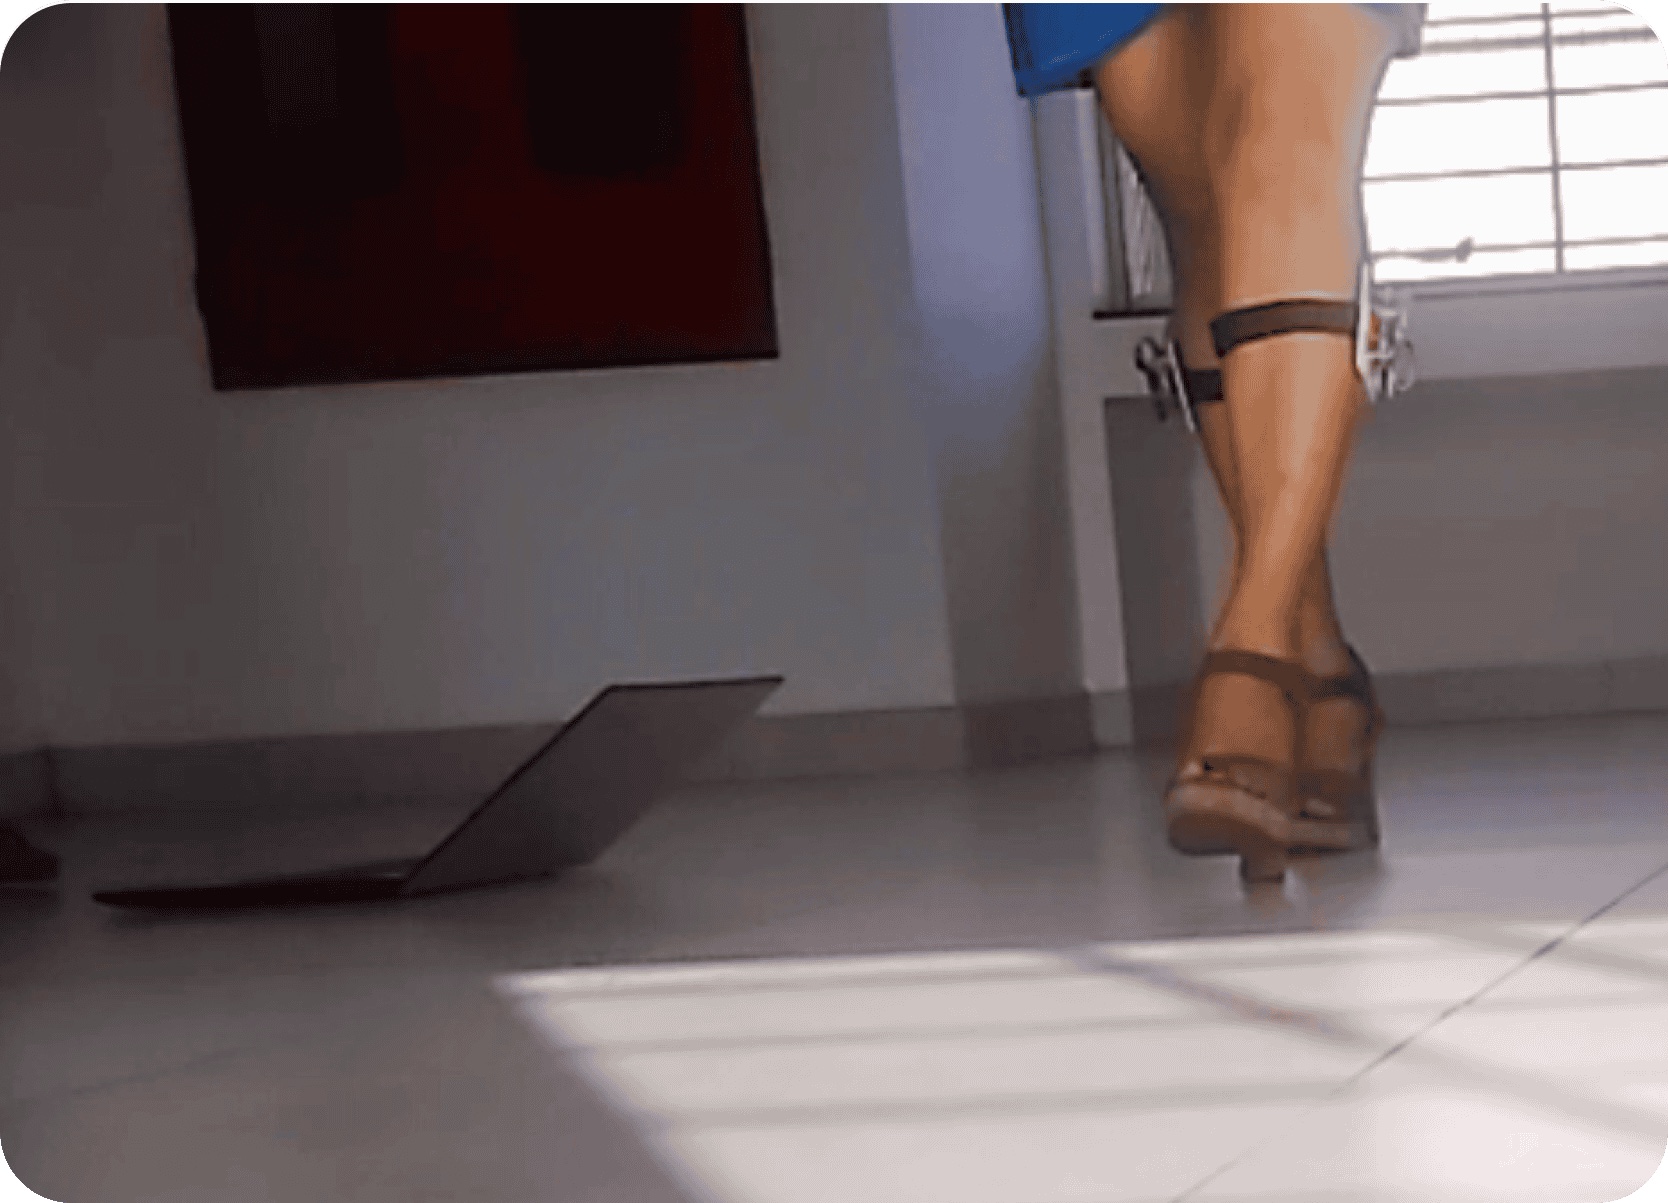
Sensors were attached, Bluetooth connection was established, each participant walked a 5m back-and-forth path while data was recorded to CSV, and the process was repeated for each condition. Video was also recorded for reference.
Post-Test
Participants were shown visualizations of their own and others' gait data and then asked for feedback on clarity, usefulness, and possible applications.
Key Findings
Visualization effectiveness: Participants found the visualizations informative and could recognize differences between left and right leg movement, as well as how footwear altered gait compared with barefoot walking. They saw the potential value for choosing better footwear.
Awareness: The visuals increased awareness of footwear’s impact and the importance of comfort for maintaining a natural gait pattern.
Clarity issues: Left-right color coding was not immediately obvious to everyone. Participants suggested more intuitive visuals, perhaps directly showing foot-angle or pressure differences without requiring explanation.
Sensor stability: Some participants noted that the shank sensors could slip due to the flat base and Velcro straps, potentially affecting accuracy. More secure strapping or direct adhesion was suggested.
Potential applications: Participants proposed uses in retail shoe selection, rehabilitation progress tracking, sports performance analysis, and workplace ergonomics.
Conclusion
Conclusion and future directions.
The project showed that low-cost, IMU-based gait visualization can make footwear effects on movement more legible, but it also revealed clear opportunities to improve interpretation, attachment stability, and automation.
This project demonstrated the feasibility of using a low-cost IMU-based system to capture and visualize how different types of footwear alter walking gait patterns. The resulting visualizations were informative for users and increased awareness of the relationship between footwear, comfort, and natural movement.
Future work should focus on:
Improving visualization: Develop more intuitive visual representations of gait parameters, such as foot-angle views, that require less interpretation.
Enhancing sensor stability: Implement more secure and ergonomic sensor attachment methods such as buckles or adhesive approaches.
Refining methodology: Use longer walking distances, multiple trials per condition, and potentially paced walking to improve consistency.
Automation: Integrate algorithms or machine learning for automatic gait-parameter detection so quantitative outputs can sit alongside visual ones.
This research highlights the potential for accessible technology to provide useful gait insights for footwear selection, rehabilitation, and sports science.
Research continuation
Research continuation
Slingshot emerged directly from this research into how footwear affects movement. The work began with visualizing gait changes under different conditions and naturally evolved toward a wearable device designed to provide actionable movement and performance insights.
References
Selected references.
• Indranil Manna, Dibyendu Pradhan, Seema Ghosh, Sanjit Kumar Kar and Prakash Dhara. 2001. A Comparative Study of Foot Dimension between Adult Male and Female and Evaluation of Foot Hazards due to Using of Footwear. Journal of Physiological Anthropology and Applied Human Science 20(4), pg 21–246.
• Matthew A. Nurse, Manuel Hulliger, James M. Wakeling, Benno M. Nigg, Darren J. Stefanyshyn. 2015. Changing the texture of footwear can alter gait patterns. Journal of Electromyography and Kinesiology 15, pg 496–506. https://doi.org/10.1016/j.jelekin.2004.12.003
• Jan Rueterbories, Erika G. Spaich, Birgit Larsen, Ole K. Andersen. 2010. Methods for gait event detection and analysis in ambulatory systems. Journal of Medical Engineering & Physics 32, pg 545–552.
• Jing Feng, Jane Wick, Erin Bompiani and Michael Aiona. 2016. Review Article on Current Orthopaedic Practice. Volume 27, Number 4, pg 455–464.
• Diana Trojaniello, Andrea Ravaschio, Jeffrey M. Hausdorff, Andrea Cereatti. 2015. Comparative assessment of different methods for the estimation of gait temporal parameters using a single inertial sensor. Journal of Gait & Posture. http://dx.doi.org/10.1016/j.gaitpost.2015.06.008
• Yufridin Wahab, Norantanum Abu Bakar. 2011. Gait Analysis Measurement for Sport Application Based on Ultrasonic System. IEEE 15th International Symposium on Consumer Electronics.
And 30+ additional research papers and articles referenced during the study.